
HOPS 60
|
Distance (pc) |
Zone |
|||||||
|
19.2 |
54.1 |
0 |
392.8 |
OMC 2 |
||||
|
ALMA 0.87 mm |
||||||||
|
Source |
||||||||
|
HOPS-60 |
05:35:23.287 |
-05:12:03.41 |
336.13 ± 5.99 |
112.76 |
1.45 |
0.7 |
0.19 x 0.11 |
159 |
|
VLA 9 mm |
||||||||
|
Source |
||||||||
|
HOPS-60 |
05:35:23.288 |
-05:12:03.41 |
1.21 ± 0.02 |
0.75 |
8.1 |
0.7 |
0.08 x 0.06 |
153.5 |
|
ACA 0.87 mm |
||||||||
|
Source |
||||||||
|
HOPS-60 |
05:35:23.328 |
-05:12:03.24 |
751.55 |
467.23 |
9.19 |
- |
- |
- |
ALMA and VLA Derived Parameters
|
Source |
||||||||
|
HOPS-60 |
62.7 ± 10.0 |
28.0 ± 10.0 |
152.7 ± 2.7 |
790.3 ± 13.7 |
1.57 |
0.38 |
2.4 ± 0.06 |
1.7 ± 0.15 |
Sources next/close to me: -
Same source, other names: SOF7, FIR6b, Source 39 (Díaz-Rodríguez et al).
Source Images
Left: ALMA (0.87 mm), Right: VLA (9 mm) (Tobin et al. 2020),
Bottom: ACA (0.87 mm) (Federman et al. 2022).


Figure 1: HOPS-60.
Source 39
| RA(J2000) | DEC(J2000) | Spectral Index |
Nature Evolved Stage |
Other Names | |||||||
| 5 cm | 3 cm | 1.3 cm | 0.7 cm | 5 cm | |||||||
| 05:35:23.2891 ± 0.0011 | -05:12:03.398 ± 0.017 | 0.24 x 0.09 | 65 ± 17 | 0.13 ± 0.03 | 0.19 ± 0.03 | - | - | 0.089 ± 0.012 | 1.1 ± 0.7 | Class 0 | HOPS 60 |
VLA (5 cm, black contours) (Díaz-Rodriguez to be submitted).

Figure 2: Source 39. Superposition of the VLA A-configuration map with natural weighting at 5cm (black contours, Díaz-Rodriguez to be submitted) over ALMA emission at 870 micron (red contours, Tobin et al 2020).
FIR 6b jet intensity map (Matsushita et al. 2021)
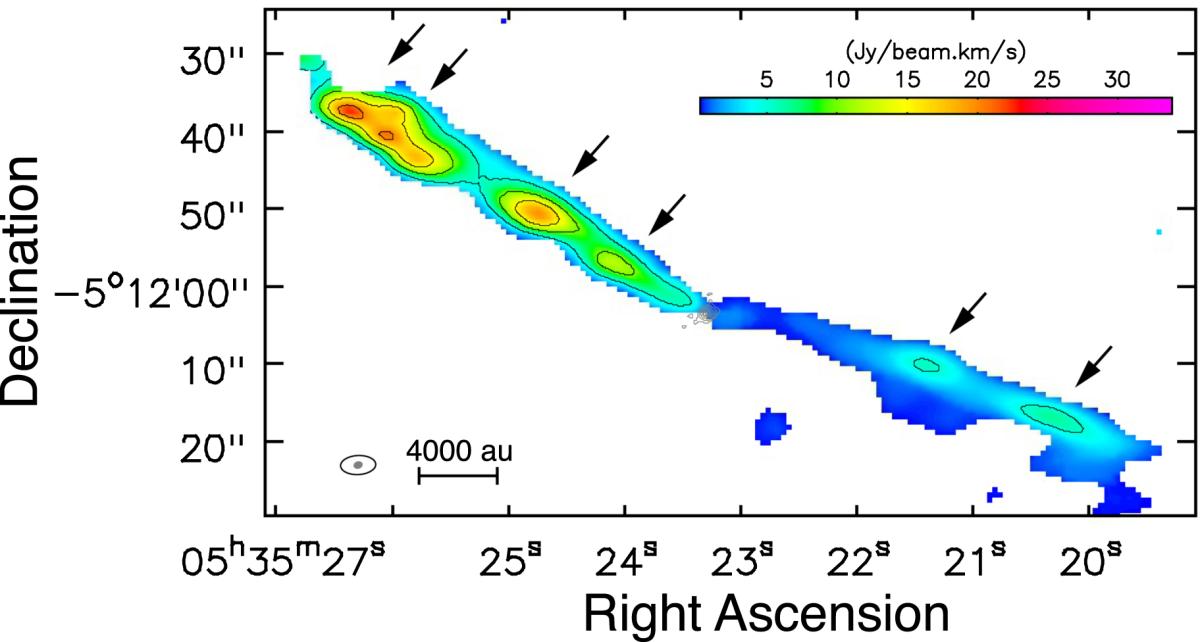
Figure 3: CO (J = 2–1) integrated intensity map of the high-velocity component of the FIR 6b jet (color and black contours). The gray contours show the 1.3 mm continuum emission.
FIR 6b jet velocity maps (Matsushita et al. 2021)
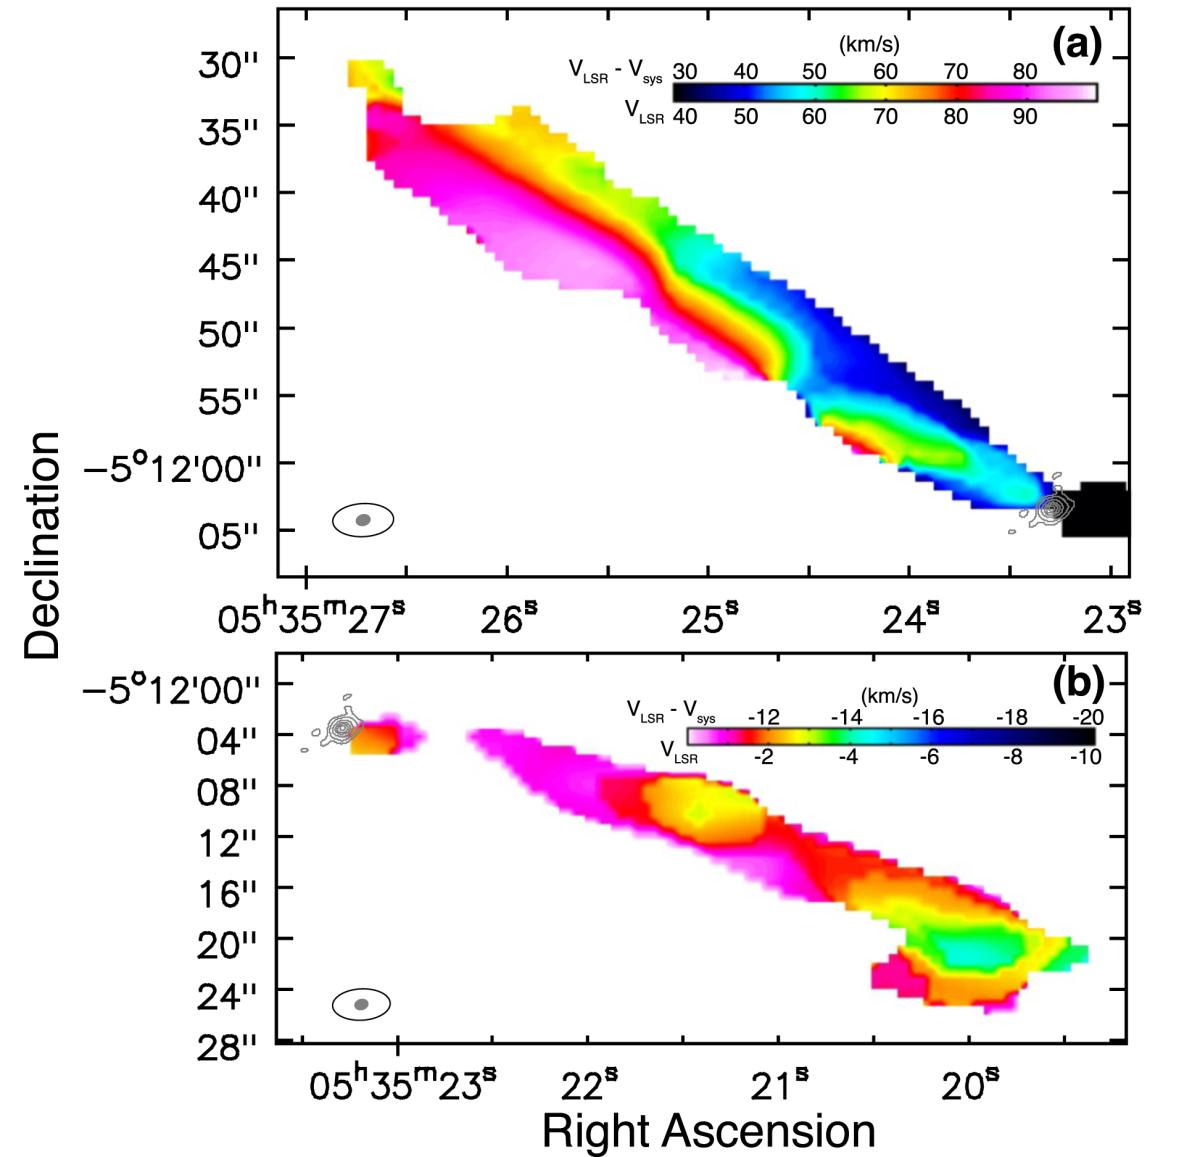
Figure 4: CO (J = 2–1) mean velocity maps of the northeast side (redshifted, top image) and southwest side (blueshifted, bottom image) of the FIR 6b jet. The gray contours show the 1.3 mm continuum emission.
FIR 6b jet intensity map (Soker et al. 2022)
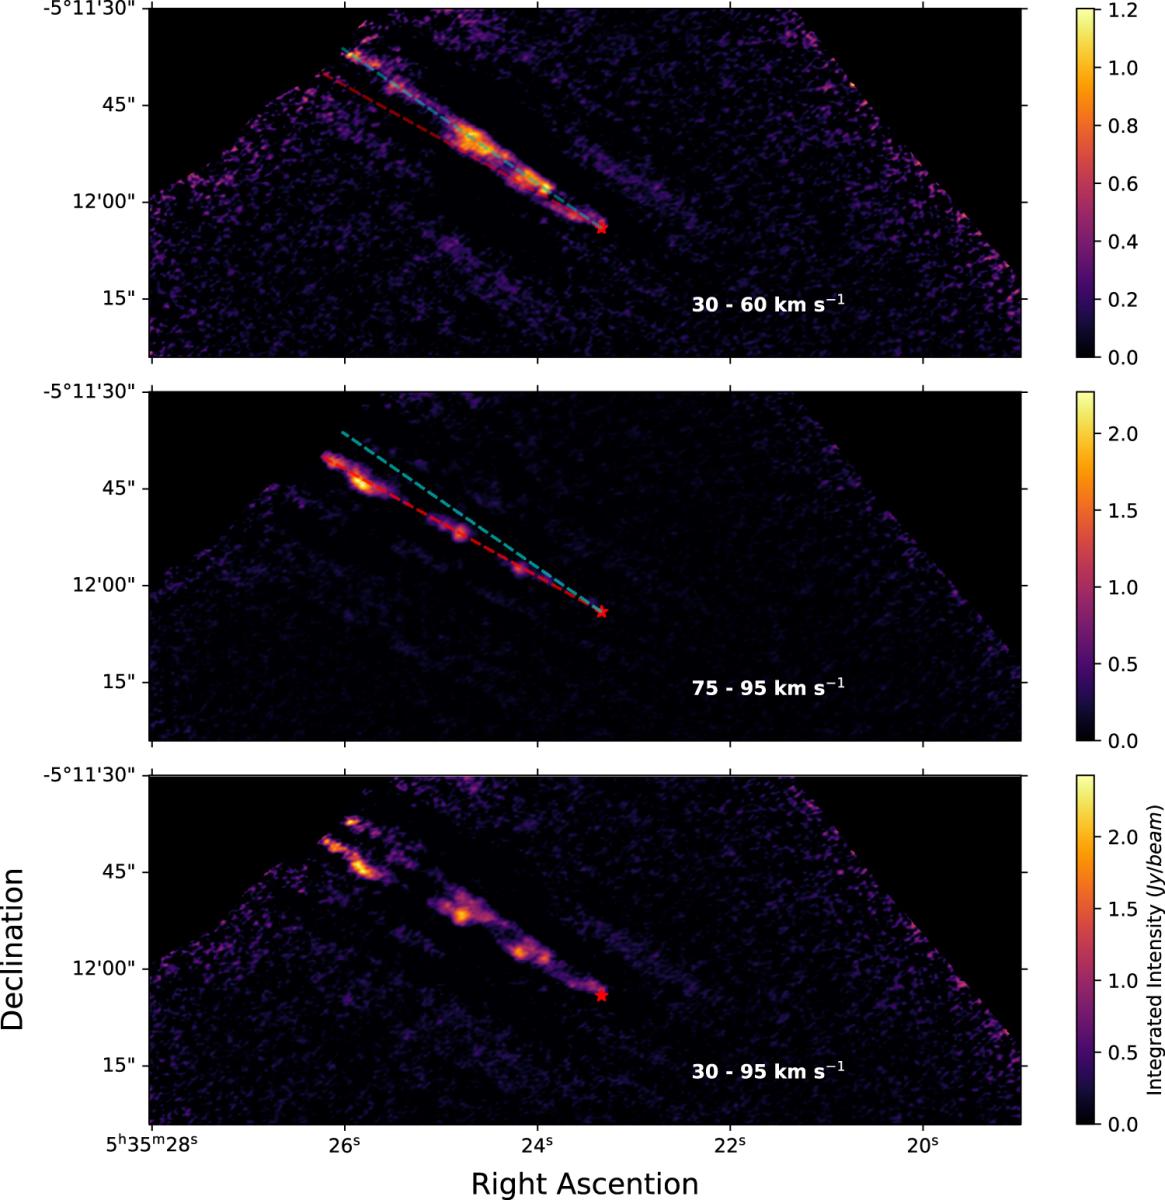
Figure 5: CO emission maps from the two (twin) components of the redshifted FIR 6b jet. Top: northern twin-jet component. Middle: southern twin-jet component. Bottom: redshifted jet.
HOPS 60 (Sato et al. 2023)
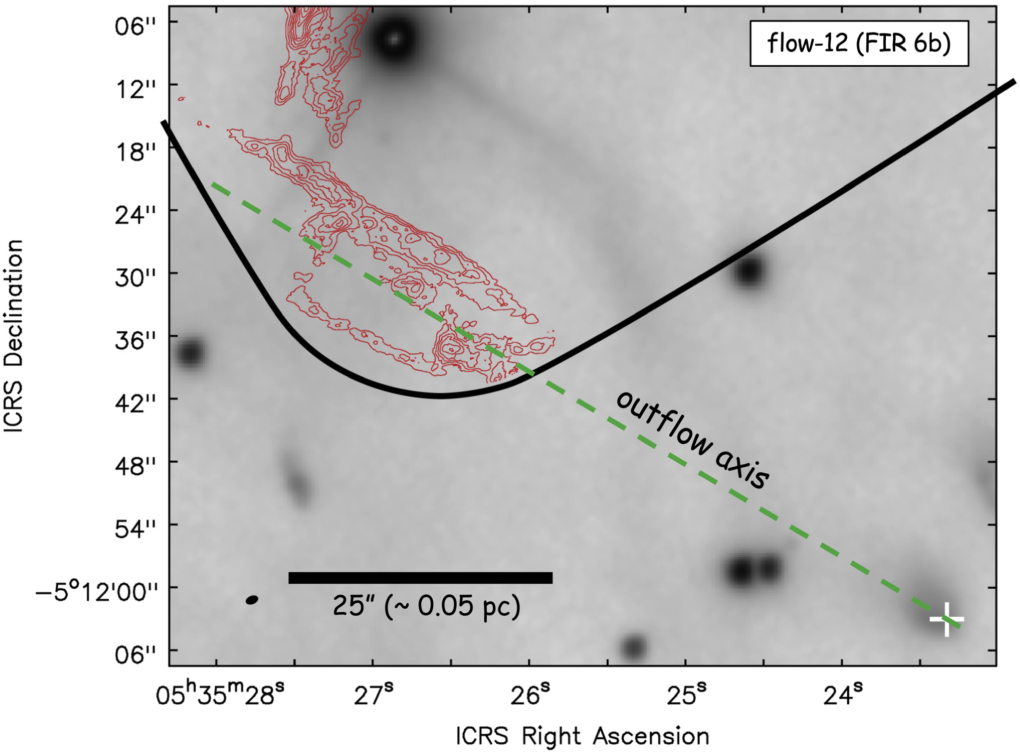
Figure 6: HOPS 60. Gray background shows the 2.2 μm Ks band image obtained from SIRIUS/IRSF (Takahashi et al. 2008). The white cross denotes the position of the outflow driving source (FIR 6b, Matsushita et al. 2021). The red contours represent the integrated intensity of the redshifted CO components obtained from the ALMA 12 m array. The black solid line is the boundary of Sato et al. (2023) observation mapping. The green-dashed line represents the outflow axis.