
HOPS 70
|
Distance (pc) |
Zone |
|||||||
|
6.0 |
619.3 |
Flat |
392.8 |
OMC 2 |
||||
|
ALMA 0.87 mm |
||||||||
|
Source |
||||||||
|
HOPS-70-A-A |
05:35:22.406 |
-05:08:05.14 |
35.89 ± 0.54 |
28.45 |
0.26 |
0.4 |
0.05 x 0.05 |
13.4 |
|
HOPS-70-A-B |
05:35:22.426 | -05:08:05.03 | 3.37 ± 0.54 | 2.73 | 0.26 | 0.3 | - | - |
|
HOPS-70-B-A |
- | - | ≤ 0.77 | ≤ 0.77 | 0.31 | 4.6 | - | - |
|
HOPS-70-B-B |
05:35:22.571 | -05:08:00.32 | 7.89 ± 0.53 | 6.43 | 0.32 | 5.1 | 0.07 x 0.03 | 51.2 |
|
HOPS-70-C |
05:35:21.938 |
-05:08:04.58 |
8.63 ± 0.84 |
3.77 |
0.40 |
7.1 |
0.17 x 0.07 |
78.3 |
|
VLA 9 mm |
||||||||
|
Source |
||||||||
|
HOPS-70-A-A |
05:35:22.406 |
-05:08:05.14 |
0.29 ± 0.02 |
0.22 |
9.64 |
25.5 |
0.05 x 0.04 |
72.2 |
|
HOPS-70-A-B |
05:35:22.426 |
-05:08:05.03 |
0.04 ± 0.01 |
0.03 |
9.57 |
25.2 |
0.03 x 0.01 |
104.4 |
| HOPS-70-B-A | 05:35:22.562 |
-05:08:00.72 |
0.13 ± 0.01 | 0.12 | 8.93 | 21.6 | 0.03 x 0.01 | 104.4 |
| HOPS-70-B-B | 05:35:22.571 |
-05:08:00.32 |
0.07 ± 0.01 | 0.06 | 8.90 | 21.4 | 0.03 x 0.01 | 104.4 |
| HOPS-70-C | 05:35:21.938 |
-05:08:04.58 |
≤ 0.03 | ≤ 0.03 | 16.90 | 31.7 | - | - |
|
ACA 0.87 mm |
||||||||
|
Source |
||||||||
|
HOPS-70 |
05:35:22.416 |
-05:08:04.92 |
98.48 |
41.04 |
4.4 |
- |
- |
- |
ALMA and VLA Derived Parameters
|
Source |
||||||||
|
HOPS-70-A-A |
17.3 ± 10.0 |
16.3 ± 10.0 |
22.5 ± 0.3 |
253.4 ± 19.3 |
19.3 |
19.84 |
2.1 ± 0.07 |
3.1 ± 0.48 |
|
HOPS-70-A-B |
- |
10.0 ± 10.0 |
2.1 ± 0.3 |
33.2 ± 9.0 |
- |
14.506 |
1.9 ± 0.13 |
2.2 ± 1.46 |
|
HOPS-70-B-A |
- | 10.0 ± 10.0 | ≤ 0.6 | 110.1 ± 8.4 | - | 4.375 | - | -0.6 ± 0.67 |
|
HOPS-70-B-B |
22.7 ± 10.0 | 10.0 ± 10.0 | 4.9 ± 0.4 | 62.0 ± 8.4 | 85.19 | 7.76 | 2.0 ± 0.08 | 2.4 ± 0.97 |
|
HOPS-70-C |
56.0 ± 10.0 | - | 5.4 ± 0.8 | ≤ 29.4 | 63.010 | - | - | - |
Sources next/close to me: -
Same source, other names: Source 12 (Díaz-Rodríguez et al).
Source Images
Left: ALMA (0.87 mm), Right: VLA (9 mm) (Tobin et al. 2020).
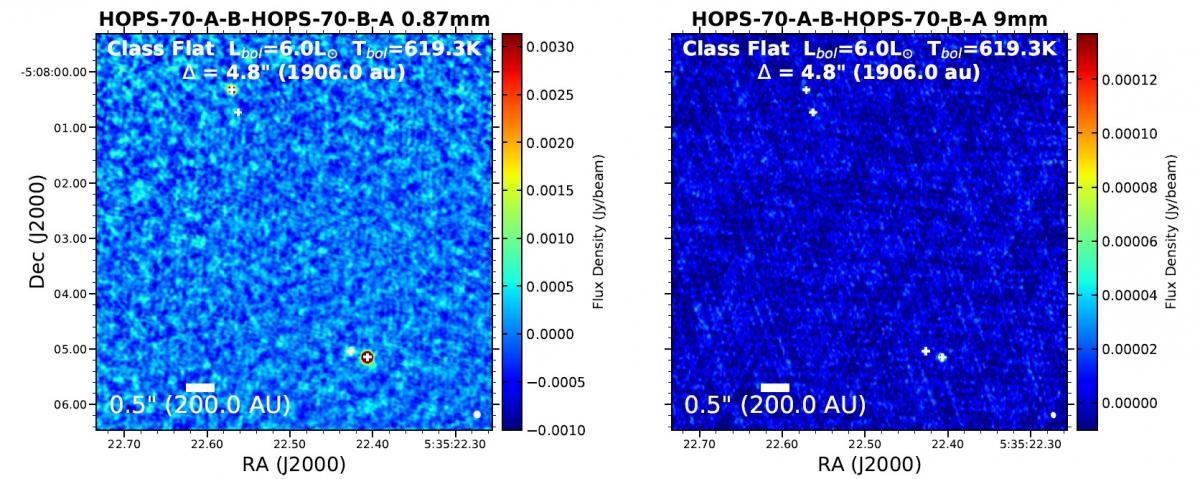
Figure 1: HOPS-70-A-B at south west and HOPS-B-A at north east.
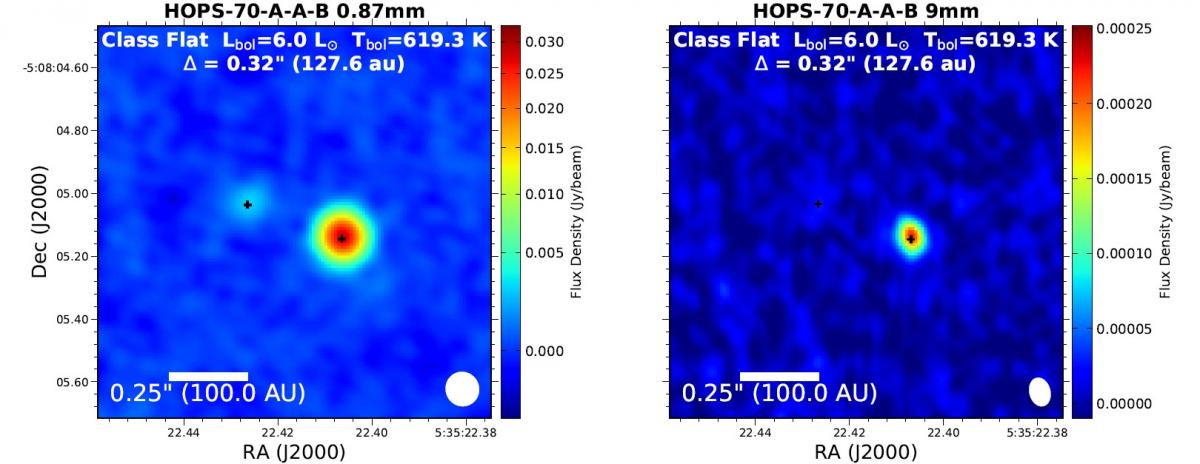
Figure 2: HOPS-70-A-B at north east and HOPS-70-A-A at west.
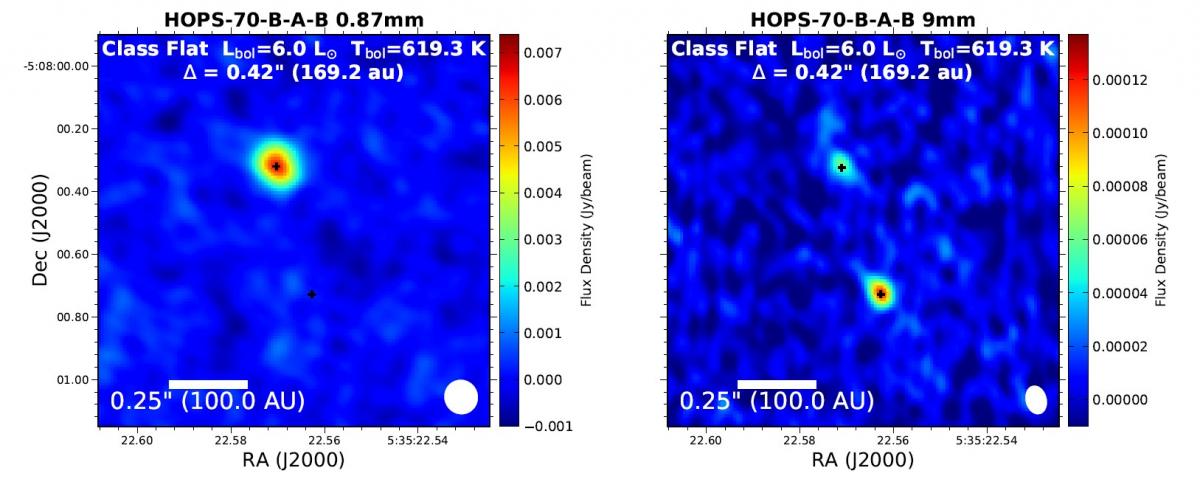
Figure 3: HOPS-70-B-B at north and HOPS-B-A at south.
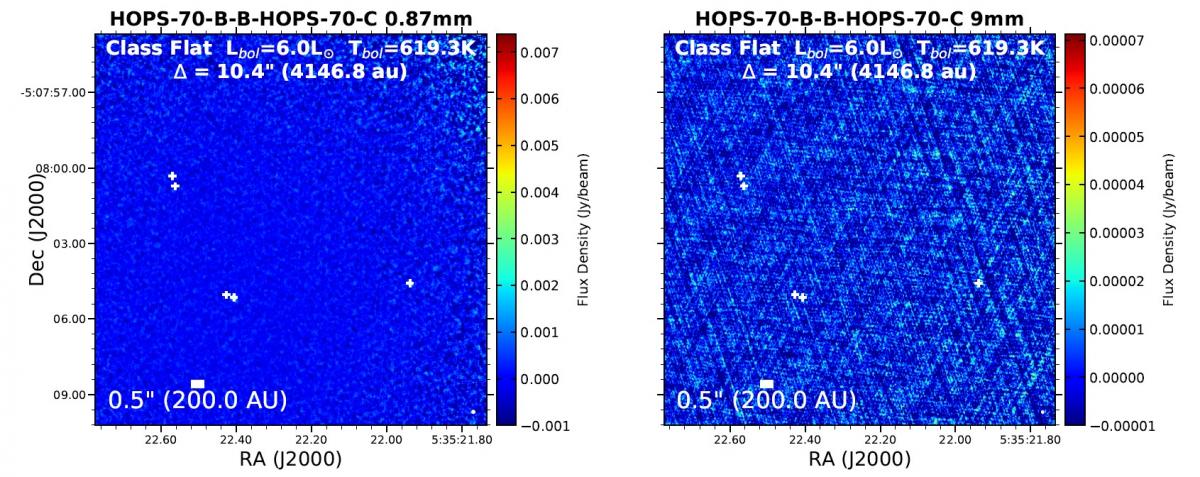
Figure 4: HOPS-70-A-B at north east, HOPS-70-B-A at south east and HOPS-70-C at west.
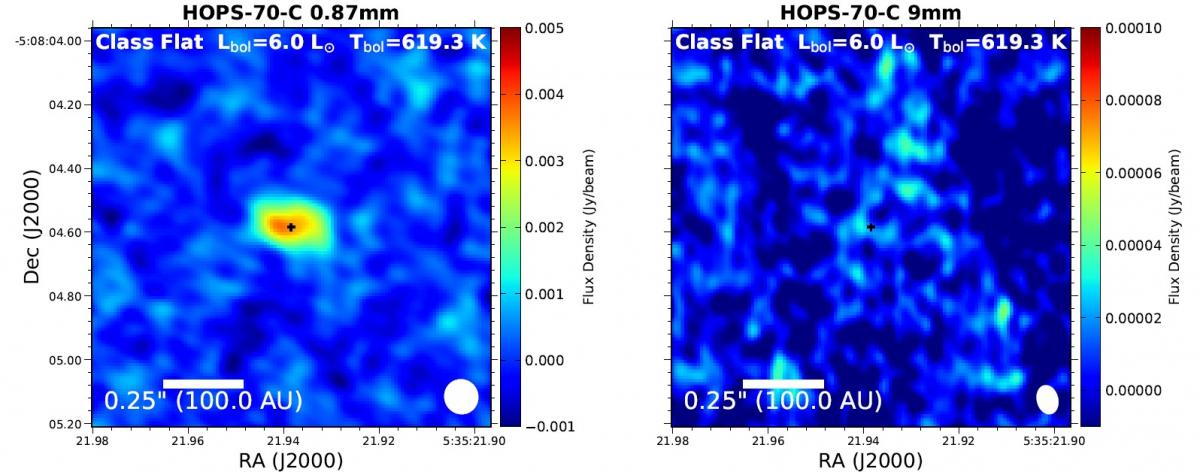
Figure 5: HOPS-70-C.
ACA (0.87 mm) (Federman et al. 2022).
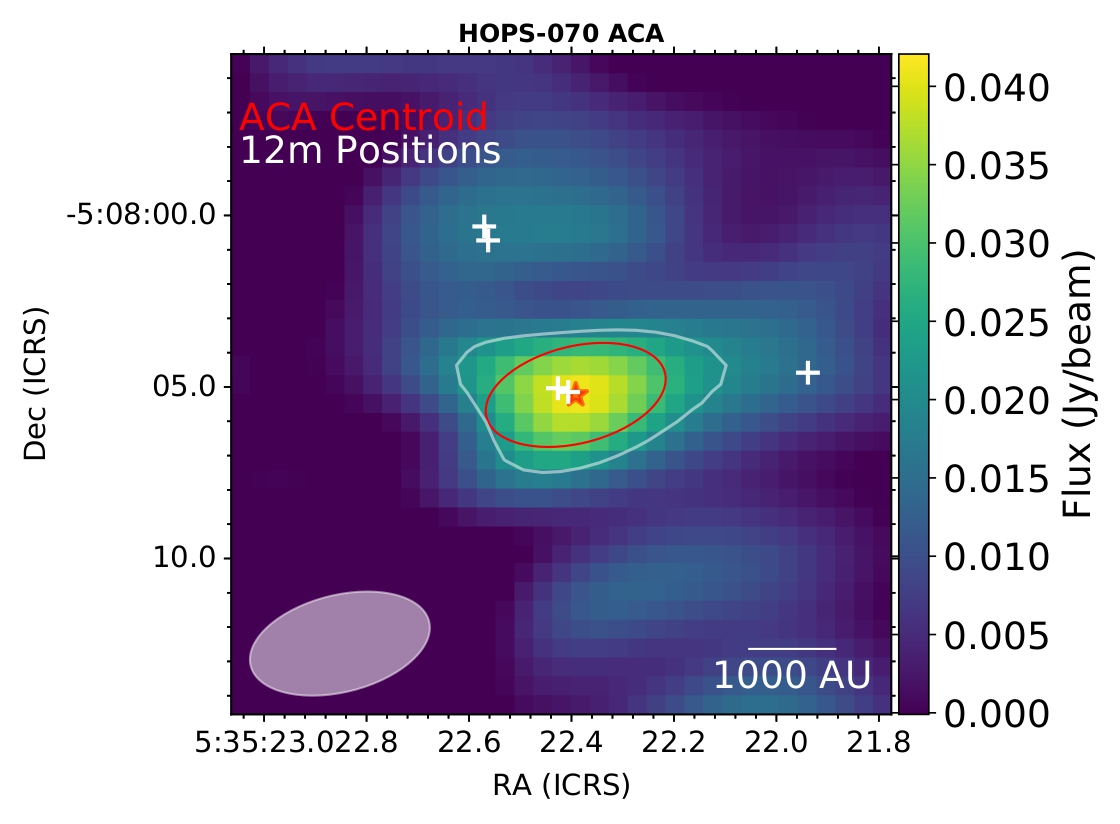
Figure 6: HOPS-70.
Source 12
| RA(J2000) | DEC(J2000) | Spectral Index |
Nature Evolved Stage |
Other Names | |||||||
| 5 cm | 3 cm | 1.3 cm | 0.7 cm | 5 cm | |||||||
| 05:35:22.5628 ± 0.0007 | -05:08:00.741 ± 0.011 | 0.28 x 0.16 | 45 ± 17 | 0.063 ± 0.013 | 0.066 ± 0.016 | - | - | 0.26 ± 0.03 | 0.1 ± 0.6 | Class I/II? | - |
VLA (5 cm, black contours) (Díaz-Rodriguez to be submitted).
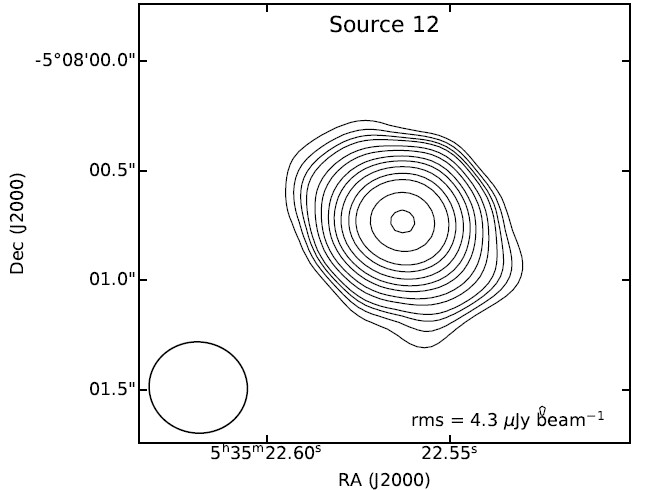
Figure 7: Source 12. Superposition of the VLA A-configuration map with natural weighting at 5cm (black contours, Díaz-Rodriguez to be submitted) over ALMA emission at 870 micron (red contours, Tobin et al 2020).
Scattered dust emission as observed by the HST (Habel et al. 2021 ApJ, 911, 153).
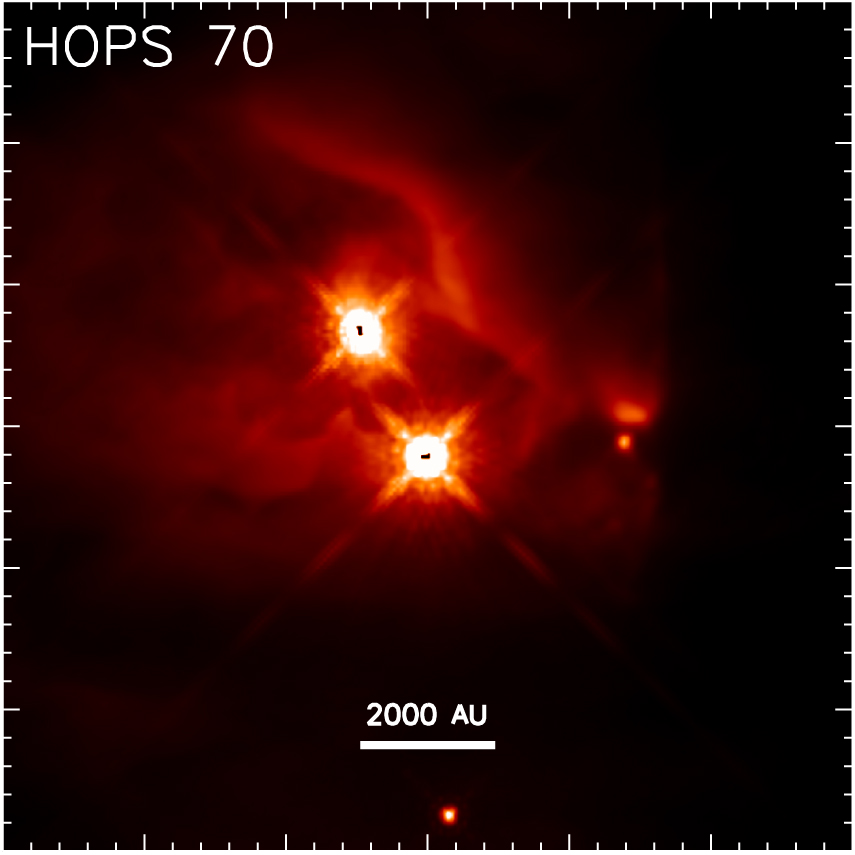
Figure 8.