
HOPS 78
|
Distance (pc) |
Zone |
|||||||
|
7.8 |
38.1 |
0 |
392.8 |
OMC 3 |
||||
|
ALMA 0.87 mm |
||||||||
|
Source |
||||||||
|
HOPS-78-A |
05:35:25.966 |
-05:05:43.33 |
322.44 ± 3.44 |
45.69 |
0.55 |
2.1 |
0.44 x 0.14 |
171.1 |
|
HOPS-78-B |
05:35:26.148 | -05:05:45.80 | 8.53 ± 1.12 | 6.77 | 0.67 | 5.3 | 0.05 x 0.05 | 179.4 |
|
HOPS-78-C |
05:35:26.181 | -05:05:47.12 | 9.34 ± 1.80 | 4.49 | 0.75 | 6.4 | 0.17 x 0.08 | 131.9 |
|
HOPS-78-D |
05:35:25.920 | -05:05:47.70 | 6.57 ± 1.48 | 3.34 | 0.62 | 4.3 | 0.15 x 0.03 | 175.4 |
|
HOPS-78-E |
- |
- |
- |
- |
- |
- |
- |
- |
|
VLA 9 mm |
||||||||
|
Source |
||||||||
|
HOPS-78-A |
05:35:25.966 |
-05:05:43.36 |
0.825 ± 0.022 |
0.495 |
7.62 |
2.2 |
0.09 x 0.08 |
49.5 |
|
HOPS-78-B |
05:35:26.148 |
-05:05:45.81 |
0.088 ± 0.014 |
0.081 |
7.69 |
5.3 |
- |
- |
| HOPS-78-C | 05:35:26.181 |
-05:05:47.13 |
0.042 ± 0.007 | 0.041 | 7.73 | 6.4 | - | - |
| HOPS-78-D | 05:35:25.920 |
-05:05:47.70 |
≤ 0.02 | ≤ 0.02 | 7.76 | 4.3 | - | - |
| HOPS-78-E | 05:35:25.763 |
-05:05:43.83 |
0.046 ± 0.007 | 0.039 | 7.6 | 0.9 | - | - |
|
ACA 0.87 mm |
||||||||
|
Source |
||||||||
|
HOPS-78 |
05:35:25.824 |
-05:05:43.8 |
1000.54 |
541.71 |
5.6 |
- |
- |
- |
ALMA and VLA Derived Parameters
|
Source |
||||||||
|
HOPS-78-A |
147.1 ± 10.0 |
31.4 ± 10.0 |
187.9 ± 2.1 |
675.5 ± 18.0 |
1.30 |
0.55 |
2.6 ± 0.06 |
0.2 ± 0.22 |
|
HOPS-78-B |
18.0 ± 10.0 |
- |
5.0 ± 0.8 |
72.0 ± 11.6 |
82.78 |
- |
2.0 ± 0.11 |
1.9 ± 1.44 |
|
HOPS-78-C |
56.0 ± 13.0 | - | 5.4 ± 1.5 | 34.4 ± 5.8 | 58.22 | - | 2.3 ± 0.12 | 2.4 ± 1.38 |
|
HOPS-78-D |
51.4 ± 15.0 | - | 3.8 ± 1.0 | ≤ 19 | 84.63 | - | - | - |
|
HOPS-78-E |
- | - | - | 37.7 ± 5.7 | - | - | - | -1.0 ± 1.64 |
Sources next/close to me: HOPS-76.
Same source, other names: VLA 5, Source 1 (Díaz-Rodríguez et al).
Source Images
Left: ALMA (0.87 mm), Right: VLA (9 mm) (Tobin et al. 2020).

Figure 1.1: At north west HOPS-78-A and south east HOPS-78-B.

Figure 1.2: At south east HOPS-78-C and north west HOPS-78-B.

Figure 1.3: At south west HOPS-78-D and east HOPS-78-C.

Figure 2: HOPS-78-A.

Figure 3: HOPS-78-B.

Figure 4: HOPS-78-C.

Figure 5: HOPS-78-D.

Figure 6: HOPS-78-E.
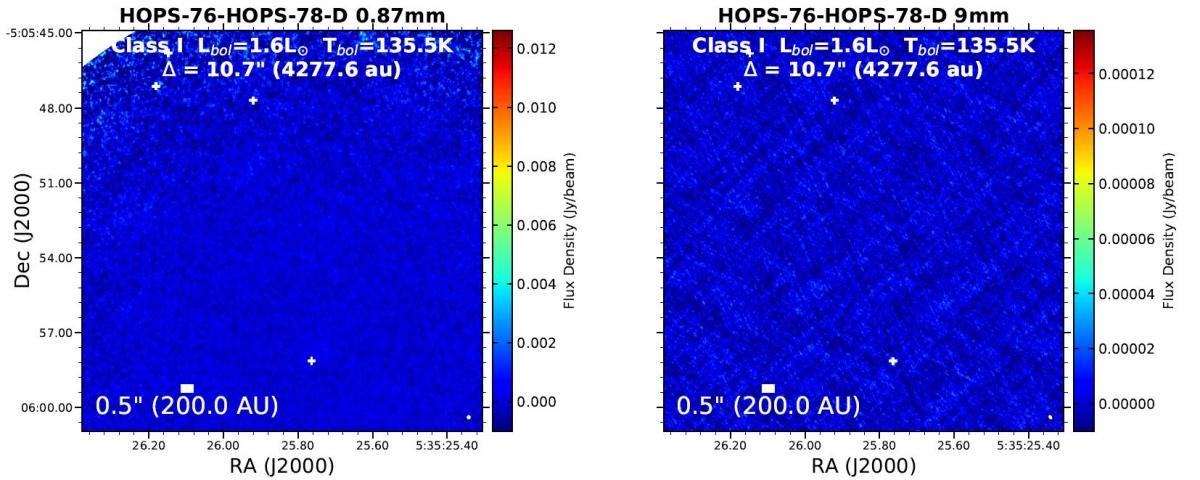
Figure 7: HOPS-78-D and HOPS-76.
ACA (0.87 mm) (Federman et al. 2022).
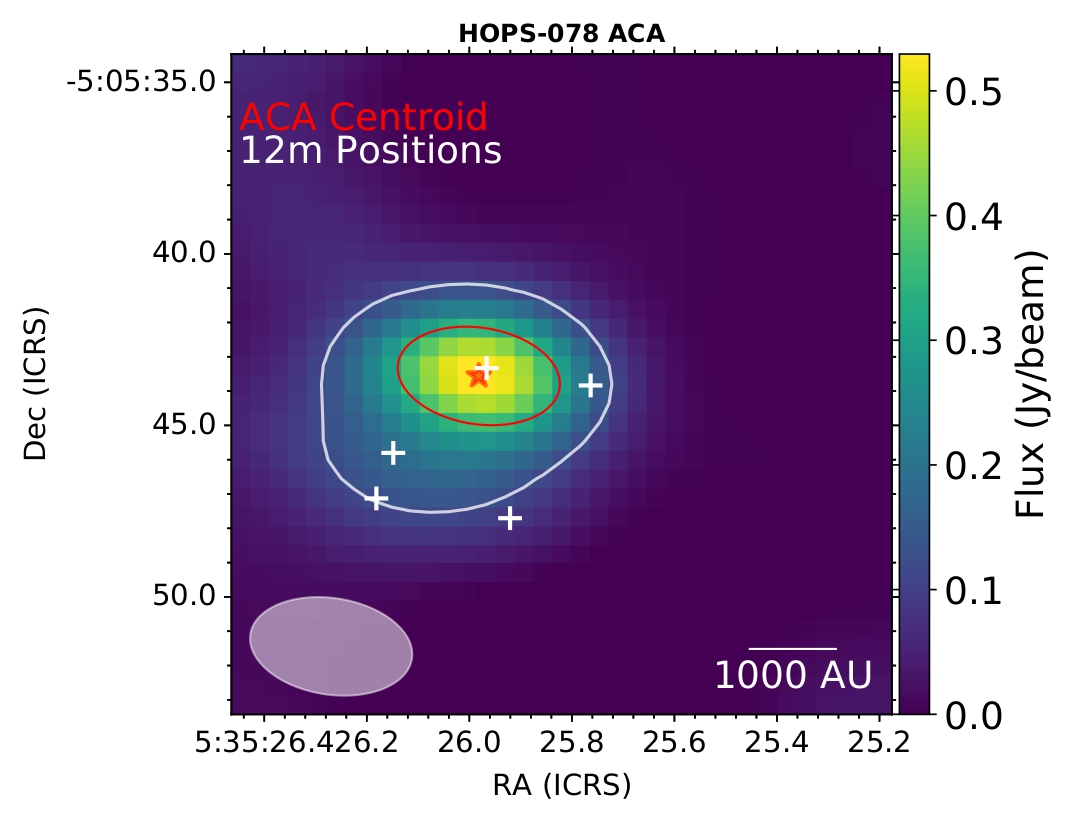
Figure 8: HOPS-78.
Source 1
| RA(J2000) | DEC(J2000) | Spectral Index |
Nature Evolved Stage |
Other Names | |||||||
| 5 cm | 3 cm | 1.3 cm | 0.7 cm | 5 cm | |||||||
| 05:35:25.9655 ± 0.0011 | -05:05:43.369 ± 0.016 | 0.5 x 0.23 | 99 ± 5 | < 0.65 | - | - | - | 0.37 ± 0.04 | -0.3 ± 1.3 | Class 0 | HOPS-78 |
VLA (5 cm, black contours) (Díaz-Rodriguez to be submitted).

Figure 9: Source 1. Superposition of the VLA A-configuration map with natural weighting at 5cm (black contours, Díaz-Rodriguez to be submitted) over ALMA emission at 870 micron (red contours, Tobin et al 2020).
Source 2
| RA(J2000) | DEC(J2000) | Spectral Index |
Nature Evolved Stage |
Other Names | |||||||
| 5 cm | 3 cm | 1.3 cm | 0.7 cm | 5 cm | |||||||
| 05:35:25.775 ± 0.003 | -05:05:43.84 ± 0.05 | - | - | < 0.65 | - | - | - | 0.062 ± 0.012 | - | YSO or Source 1 knot | HOPS-78-E |

Figure 10: Source 2 (HOPS-78-E). Superposition of the VLA A-configuration map with natural weighting at 5cm (black contours, Díaz-Rodriguez to be submitted) over ALMA emission at 870 micron (red contours, Tobin et al 2020).