
HOPS 75
|
Distance (pc) |
Zone |
|||||||
|
3.5 |
67.9 |
0 |
392.8 |
OMC 3 |
||||
|
ALMA 0.87 mm |
||||||||
|
Source |
||||||||
|
HOPS-75-A |
05:35:26.680 |
-05:06:10.51 |
16.07 ± 0.52 |
13.31 |
0.25 |
0..4 |
0.06 x 0.04 |
156.1 |
|
HOPS-75-B |
05:35:26.678 |
-05:06:10.76 |
1.92 ± 0.27 |
1.36 |
0.25 |
0.6 |
- |
- |
|
VLA 9 mm |
||||||||
|
Source |
||||||||
|
HOPS-75-A |
05:35:26.680 |
-05:06:10.50 |
0.18 ± 0.02 |
0.155 |
8.2 |
0.4 |
- |
- |
|
HOPS-75-B |
05:35:26.678 |
-05:06:10.76 |
≤ 0.02 |
≤ 0.02 |
8.2 |
0.6 |
- |
- |
|
ACA 0.87 mm |
||||||||
|
Source |
||||||||
|
HOPS-75 |
05:35:26.664 |
-05:06:10.44 |
184.01 |
51.67 |
1.82 |
- |
- |
- |
ALMA and VLA Derived Parameters
|
Source |
||||||||
|
HOPS-75-A |
18.3 ± 10.0 |
- |
11.7 ± 0.4 |
179.3 ± 15.0 |
43.793 |
- |
1.9 ± 0.07 |
1.4 ± 0.73 |
|
HOPS-75-B |
- |
- |
1.4 ± 0.2 |
≤ 0.24.6 |
- |
- |
- |
- |
Sources next/close to me: -
Same source, other names: -
Source Images
Left: ALMA (0.87 mm), Right: VLA (9 mm) (Tobin et al. 2020).
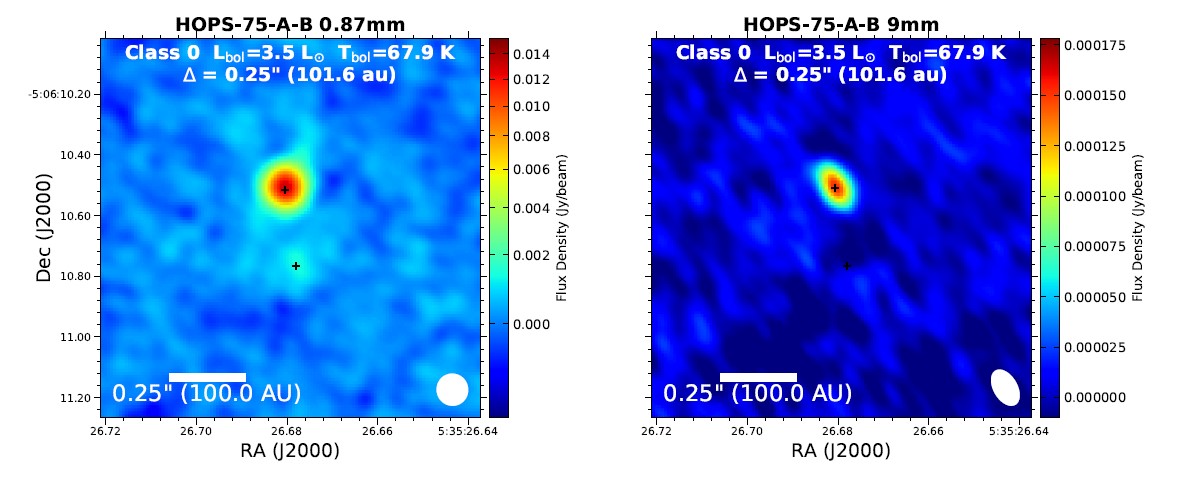
Figure 1: At north HOPS-75-A and south HOPS-75-B.
ACA (0.87 mm) (Federman et al. 2022).
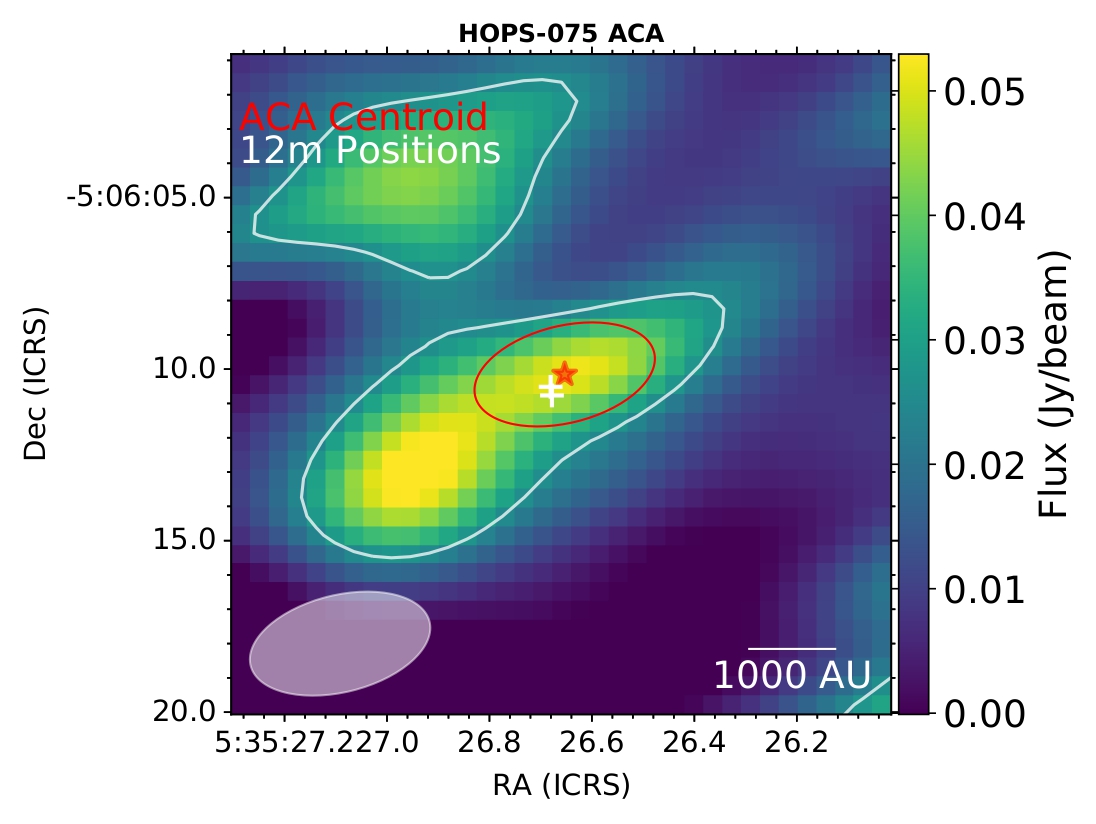
Figure 2: HOPS-75.