HOPS 70
|
Distance (pc) |
Zone |
|||||||
|
6.0 |
619.3 |
Flat |
392.8 |
OMC 2 |
||||
|
ALMA 0.87 mm |
||||||||
|
Source |
||||||||
|
HOPS-70-A-A |
05:35:22.406 |
-05:08:05.14 |
35.89 ± 0.54 |
28.45 |
0.26 |
0.4 |
0.05 x 0.05 |
13.4 |
|
HOPS-70-A-B |
05:35:22.426 | -05:08:05.03 | 3.37 ± 0.54 | 2.73 | 0.26 | 0.3 | - | - |
|
HOPS-70-B-A |
- | - | ≤ 0.77 | ≤ 0.77 | 0.31 | 4.6 | - | - |
|
HOPS-70-B-B |
05:35:22.571 | -05:08:00.32 | 7.89 ± 0.53 | 6.43 | 0.32 | 5.1 | 0.07 x 0.03 | 51.2 |
|
HOPS-70-C |
05:35:21.938 |
-05:08:04.58 |
8.63 ± 0.84 |
3.77 |
0.40 |
7.1 |
0.17 x 0.07 |
78.3 |
|
VLA 9 mm |
||||||||
|
Source |
||||||||
|
HOPS-70-A-A |
05:35:22.406 |
-05:08:05.14 |
0.29 ± 0.02 |
0.22 |
9.64 |
25.5 |
0.05 x 0.04 |
72.2 |
|
HOPS-70-A-B |
05:35:22.426 |
-05:08:05.03 |
0.04 ± 0.01 |
0.03 |
9.57 |
25.2 |
0.03 x 0.01 |
104.4 |
| HOPS-70-B-A | 05:35:22.562 |
-05:08:00.72 |
0.13 ± 0.01 | 0.12 | 8.93 | 21.6 | 0.03 x 0.01 | 104.4 |
| HOPS-70-B-B | 05:35:22.571 |
-05:08:00.32 |
0.07 ± 0.01 | 0.06 | 8.90 | 21.4 | 0.03 x 0.01 | 104.4 |
| HOPS-70-C | 05:35:21.938 |
-05:08:04.58 |
≤ 0.03 | ≤ 0.03 | 16.90 | 31.7 | - | - |
|
ACA 0.87 mm |
||||||||
|
Source |
||||||||
|
HOPS-70 |
05:35:22.416 |
-05:08:04.92 |
98.48 |
41.04 |
4.4 |
- |
- |
- |
ALMA and VLA Derived Parameters
|
Source |
||||||||
|
HOPS-70-A-A |
17.3 ± 10.0 |
16.3 ± 10.0 |
22.5 ± 0.3 |
253.4 ± 19.3 |
19.3 |
19.84 |
2.1 ± 0.07 |
3.1 ± 0.48 |
|
HOPS-70-A-B |
- |
10.0 ± 10.0 |
2.1 ± 0.3 |
33.2 ± 9.0 |
- |
14.506 |
1.9 ± 0.13 |
2.2 ± 1.46 |
|
HOPS-70-B-A |
- | 10.0 ± 10.0 | ≤ 0.6 | 110.1 ± 8.4 | - | 4.375 | - | -0.6 ± 0.67 |
|
HOPS-70-B-B |
22.7 ± 10.0 | 10.0 ± 10.0 | 4.9 ± 0.4 | 62.0 ± 8.4 | 85.19 | 7.76 | 2.0 ± 0.08 | 2.4 ± 0.97 |
|
HOPS-70-C |
56.0 ± 10.0 | - | 5.4 ± 0.8 | ≤ 29.4 | 63.010 | - | - | - |
Sources next/close to me: -
Same source, other names: Source 12 (Díaz-Rodríguez et al).
Source Images
Left: ALMA (0.87 mm), Right: VLA (9 mm) (Tobin et al. 2020).
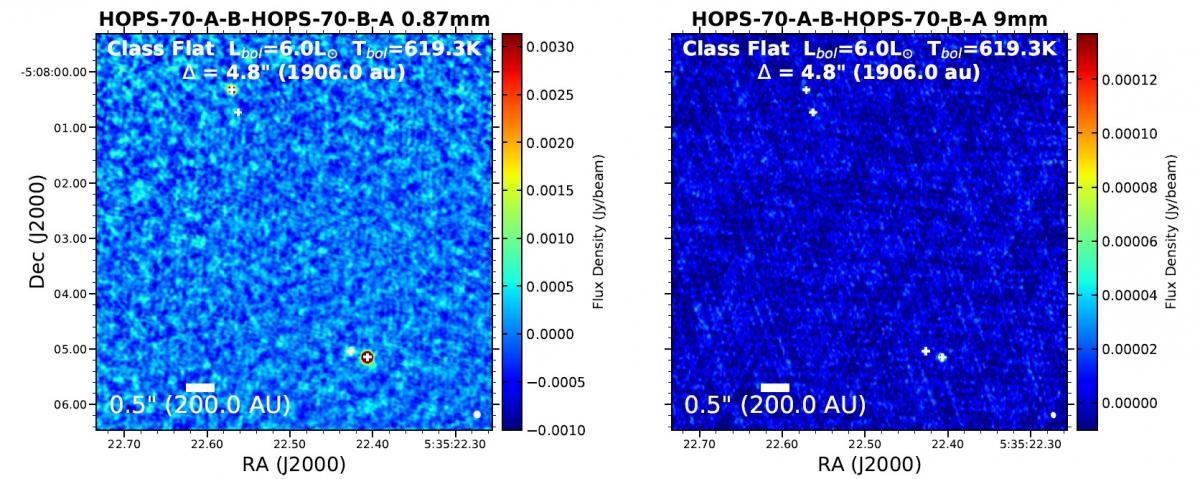
Figure 1: HOPS-70-A-B at south west and HOPS-B-A at north east.
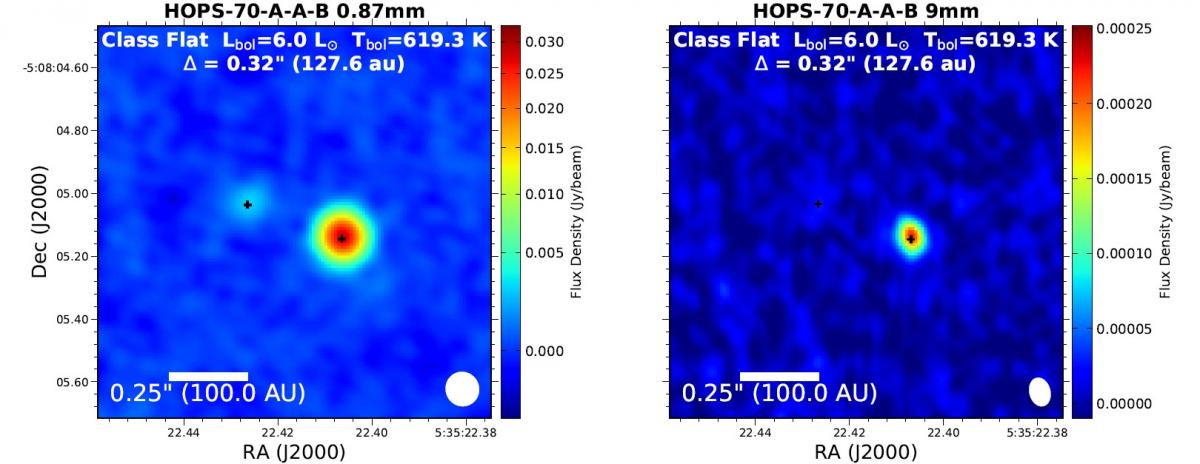
Figure 2: HOPS-70-A-B at north east and HOPS-70-A-A at west.
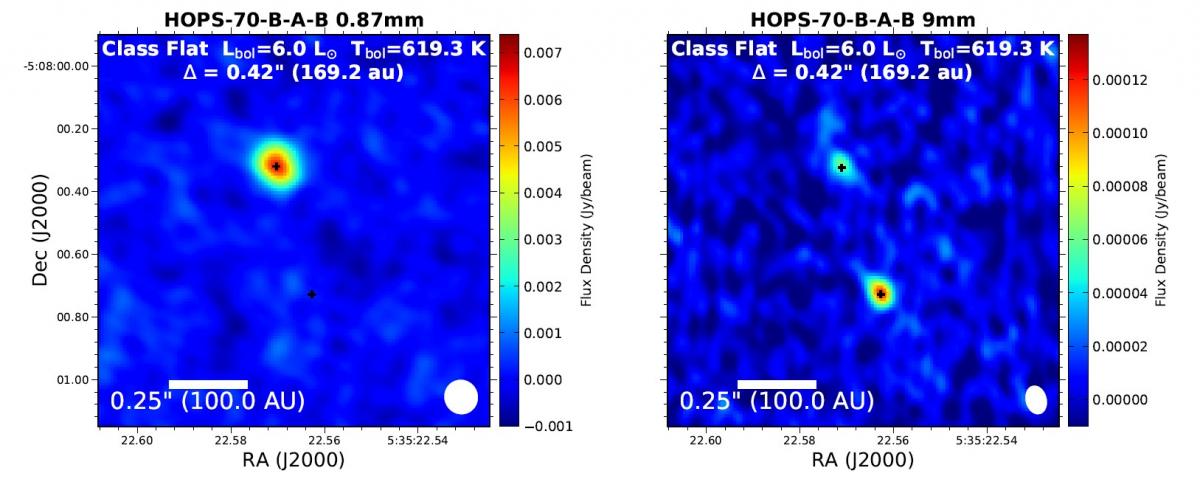
Figure 3: HOPS-70-B-B at north and HOPS-B-A at south.
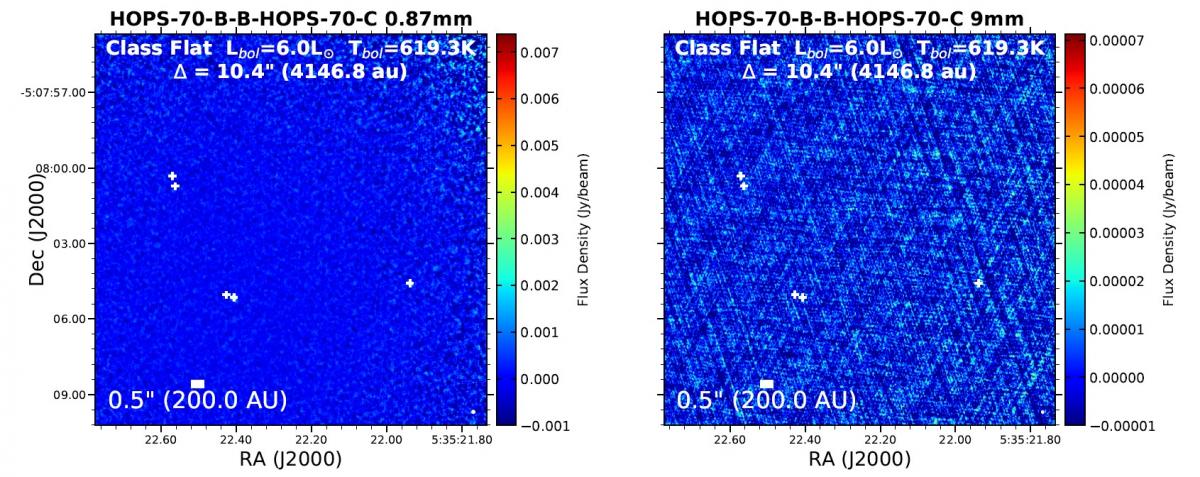
Figure 4: HOPS-70-A-B at north east, HOPS-70-B-A at south east and HOPS-70-C at west.
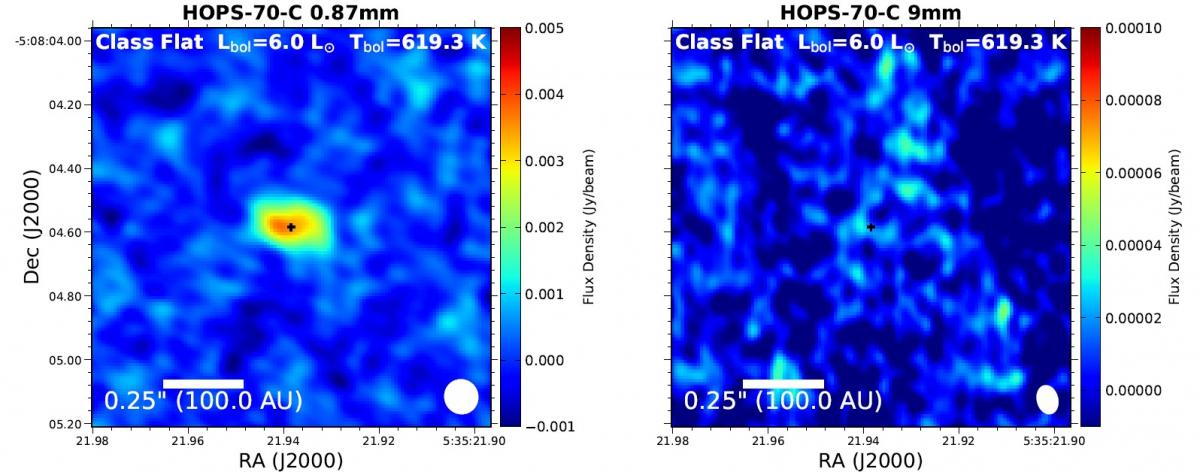
Figure 5: HOPS-70-C.
ACA (0.87 mm) (Federman et al. 2022).
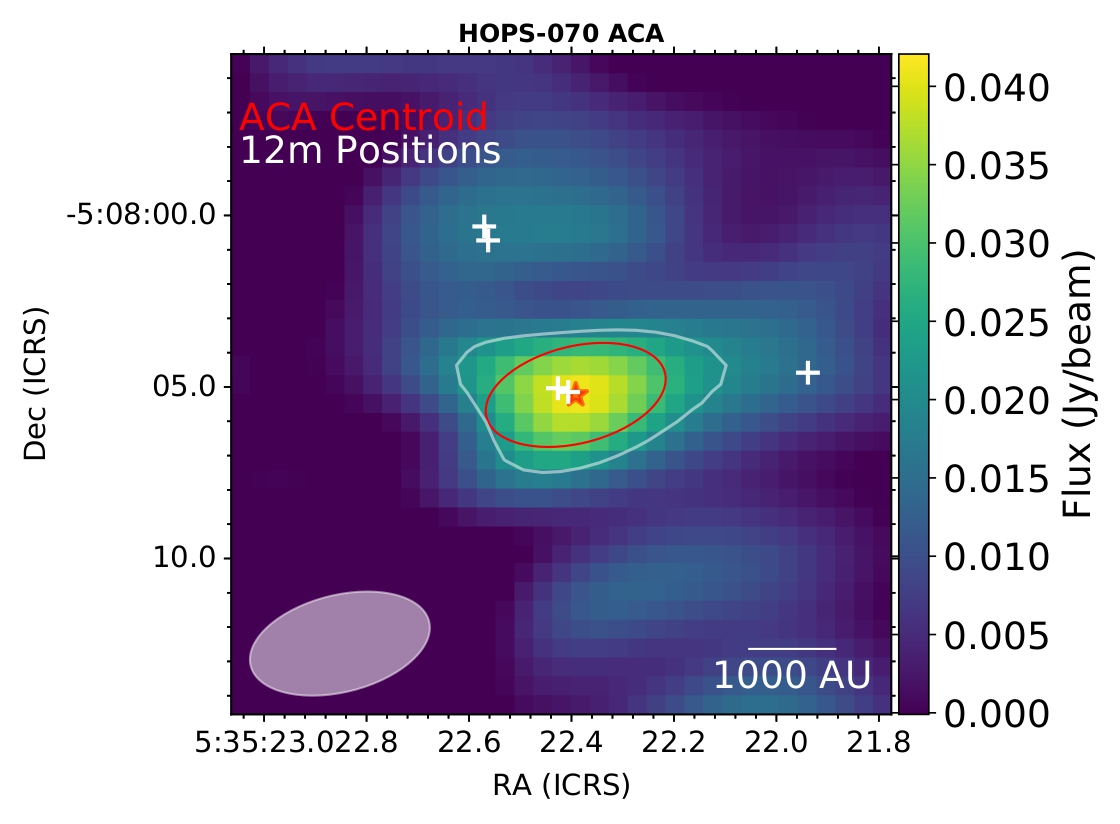
Figure 6: HOPS-70.
Source 12
| RA(J2000) | DEC(J2000) | Spectral Index |
Nature Evolved Stage |
Other Names | |||||||
| 5 cm | 3 cm | 1.3 cm | 0.7 cm | 5 cm | |||||||
| 05:35:22.5628 ± 0.0007 | -05:08:00.741 ± 0.011 | 0.28 x 0.16 | 45 ± 17 | 0.063 ± 0.013 | 0.066 ± 0.016 | - | - | 0.26 ± 0.03 | 0.1 ± 0.6 | Class I/II? | - |
VLA (5 cm, black contours) (Díaz-Rodriguez to be submitted).
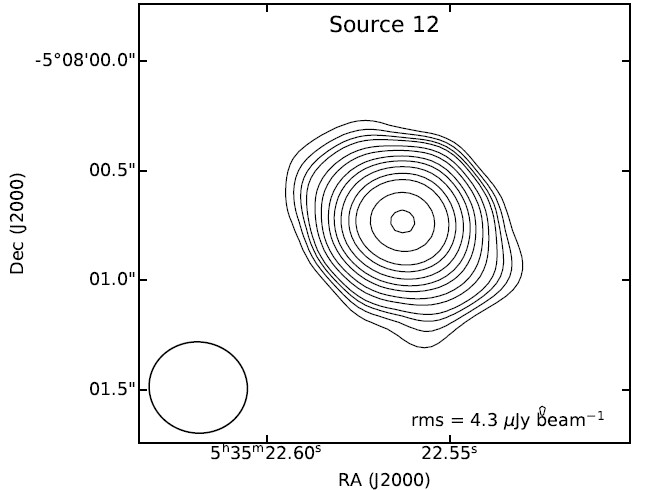
Figure 7: Source 12. Superposition of the VLA A-configuration map with natural weighting at 5cm (black contours, Díaz-Rodriguez to be submitted) over ALMA emission at 870 micron (red contours, Tobin et al 2020).
