
HOPS 408
|
Distance (pc) |
Zone |
|||||||
|
0.5 |
37.9 |
0 |
398.9 |
LDN 1641 |
||||
|
ALMA 0.87 mm |
||||||||
|
Source |
||||||||
|
HOPS-408 |
05:39:30.904 |
-07:23:56.67 |
90.37 ± 2.49 |
20.64 |
0.37 |
2.3 |
0.28 x 0.24 |
157.5 |
|
VLA 9 mm |
||||||||
|
Source |
||||||||
|
HOPS-408 |
05:39:30.905 |
-07:23:56.67 |
0.21 ± 0.02 |
0.15 |
7.22 |
2.3 |
0.07 x 0.05 |
141.4 |
|
ACA 0.87 mm |
||||||||
|
Source |
||||||||
|
HOPS-408 |
05:39:30.744 |
-07:23:59.28 |
327.09 |
240.59 |
4.12 |
- |
- |
- |
ALMA and VLA Derived Parameters
|
Source |
||||||||
|
HOPS-408 |
93.5 ± 10.0 |
22.0 ± 10.0 |
124.5 ± 3.6 |
364.1 ± 29.4 |
5.11 |
2.22 |
2.6 ± 0.07 |
1.8 ± 0.69 |
Sources next/close to me: -
Same source, other names: -
Source Images
Left: ALMA (0.87 mm), Right: VLA (9 mm) (Tobin et al. 2020),
Bottom: ACA (0.87 mm) (Federman et al. 2022).
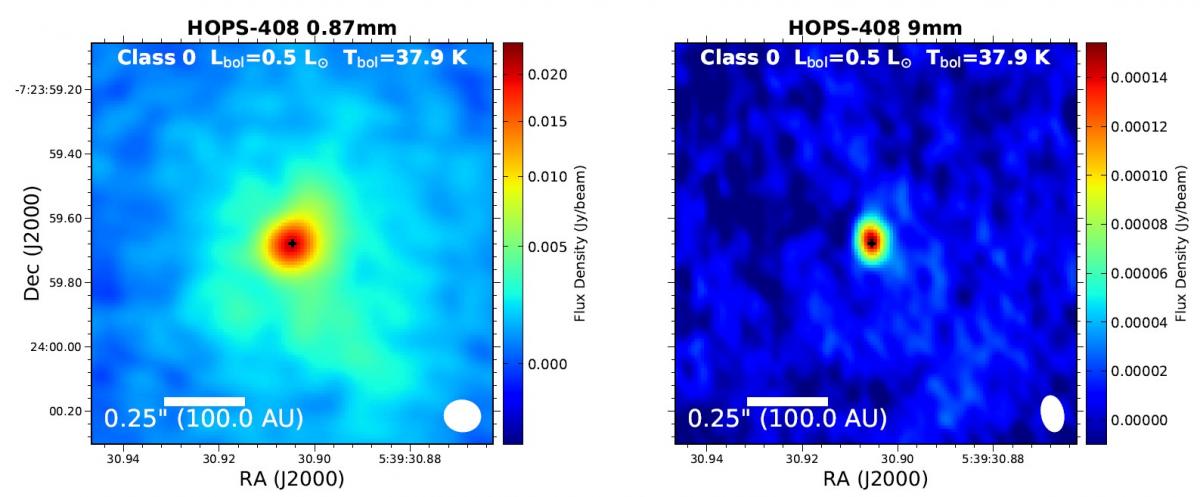
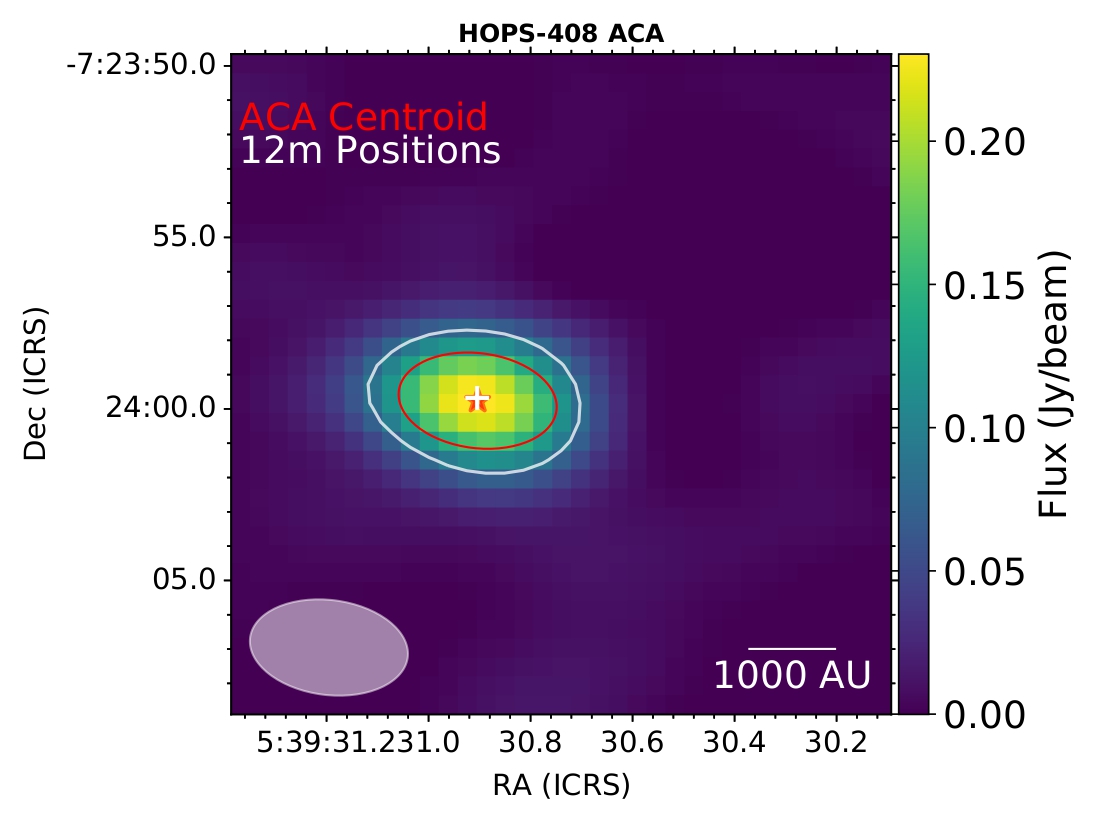
Figure 1: HOPS-408.
ALMA protostellar outflow survey (Hsieh et al. 2023).
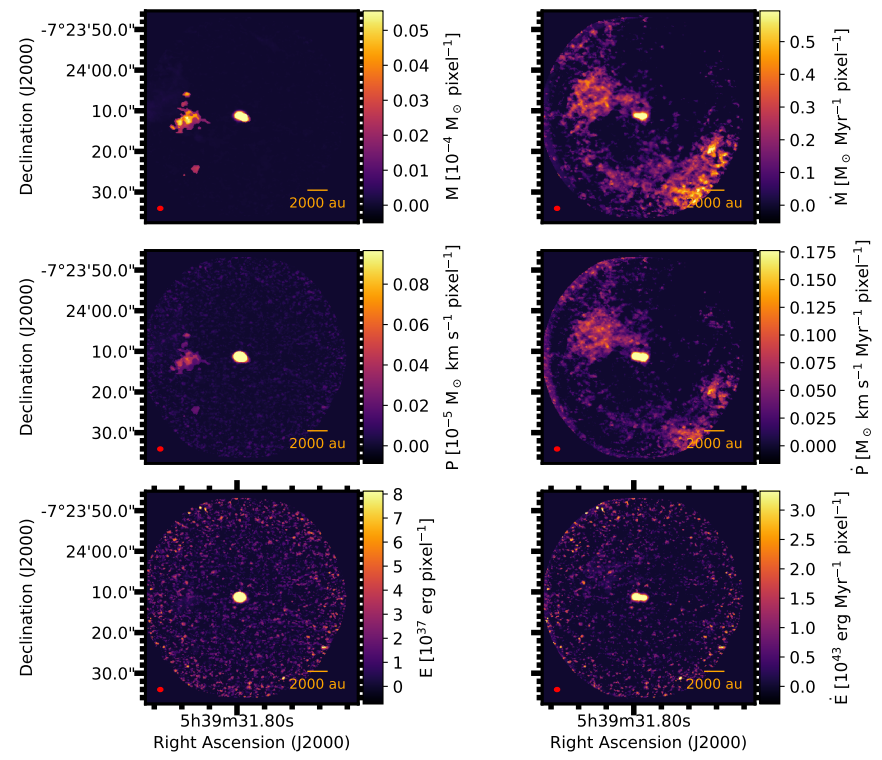
Figure 2: HOPS-408 molecular outflows mass, momentum and energy maps (panels in the left column) and the corresponding rate maps (panels in the right column).