
HOPS 389
|
Distance (pc) |
Zone |
|||||||
|
6.2 |
42.8 |
0 |
428.4 |
NGC 2068 |
||||
|
ALMA 0.87 mm |
||||||||
|
Source |
||||||||
|
HOPS-389-A |
05:46:47.019 |
00:00:27.07 |
19.72 ± 0.67 |
12.88 |
0.26 |
0.1 |
0.1 x 0.07 |
50.1 |
|
HOPS-389-B |
05:46:64.604 |
00:00:29.52 |
4.78 ± 0.33 |
3.97 |
0.39 |
6.8 |
0.06 x 0.03 |
33.4 |
|
VLA 9 mm |
||||||||
|
Source |
||||||||
|
HOPS-389-A |
05:46:47.016 |
00:00:27.04 |
0.12 ± 0.02 |
0.11 |
9.6 |
0.1 |
0.06 x 0.02 |
151.1 |
|
HOPS-389-B |
05:46:64.604 |
00:00:29.52 |
≤ 0.03 |
≤ 0.03 |
10.5 |
6.8 |
- |
- |
|
ACA 0.87 mm |
||||||||
|
Source |
||||||||
|
HOPS-389 |
05:46:47.016 |
+00:00:27 |
467.24 |
112.01 |
3.78 |
- |
- |
- |
ALMA and VLA Derived Parameters
|
Source |
||||||||
|
HOPS-389-A |
35.7 ± 10.0 |
23.3 ± 10.2 |
14.6 ± 0.5 |
127.0 ± 19.6 |
25.85 |
3.27 |
2.2 ± 0.09 |
1.6 ± 1.32 |
|
HOPS-389-B |
22.2 ± 10.0 |
- |
3.5 ± 0.4 |
≤ 32.0 |
118.628 |
- |
- |
- |
Sources next/close to me: -
Same source, other names: -
Source Images
Left: ALMA (0.87 mm), Right: VLA (9 mm) (Tobin et al. 2020).
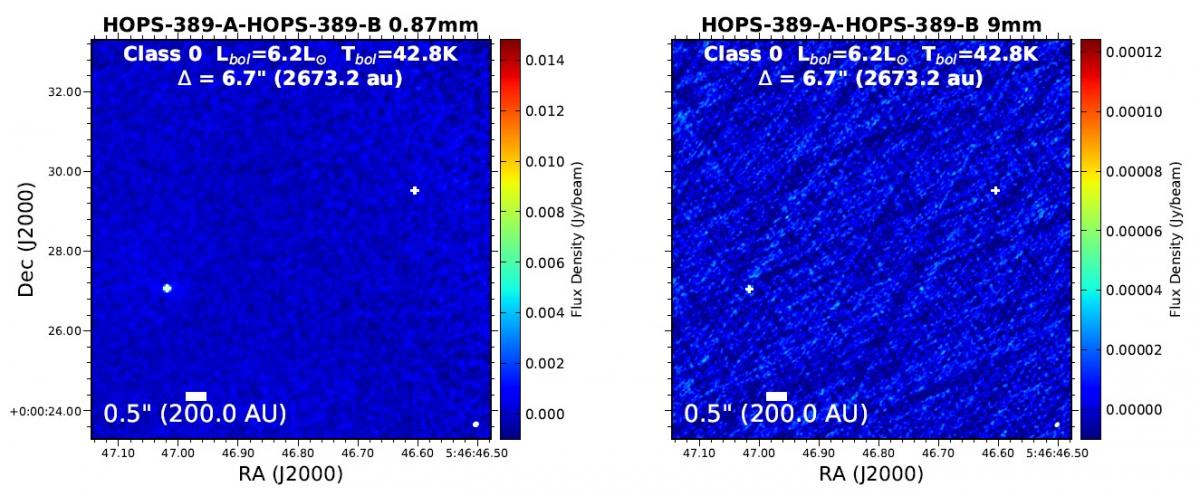
Figure 1: HOPS-389-A at south east and HOPS-389-B at north west.
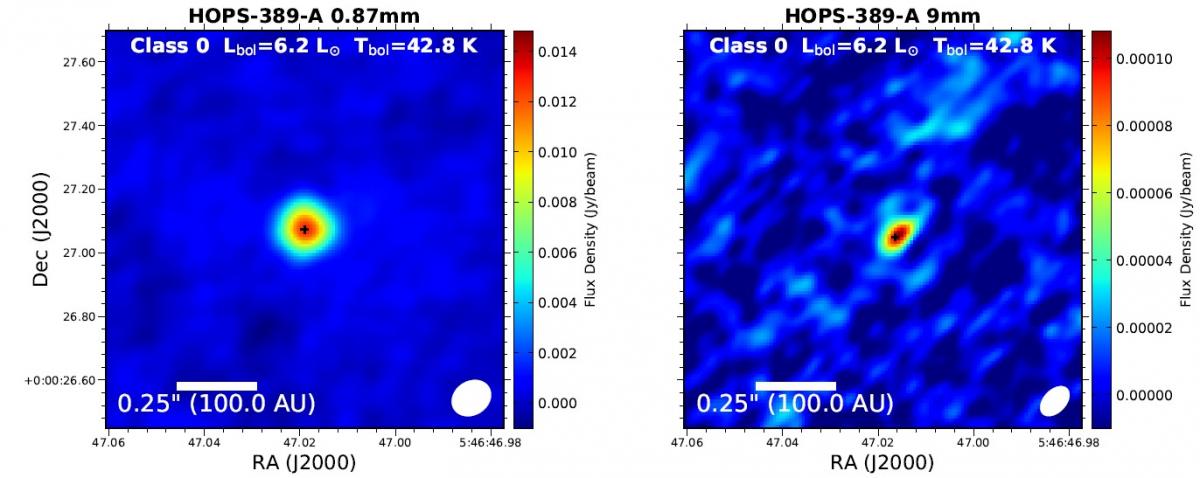
Figure 2: HOPS-389-A.
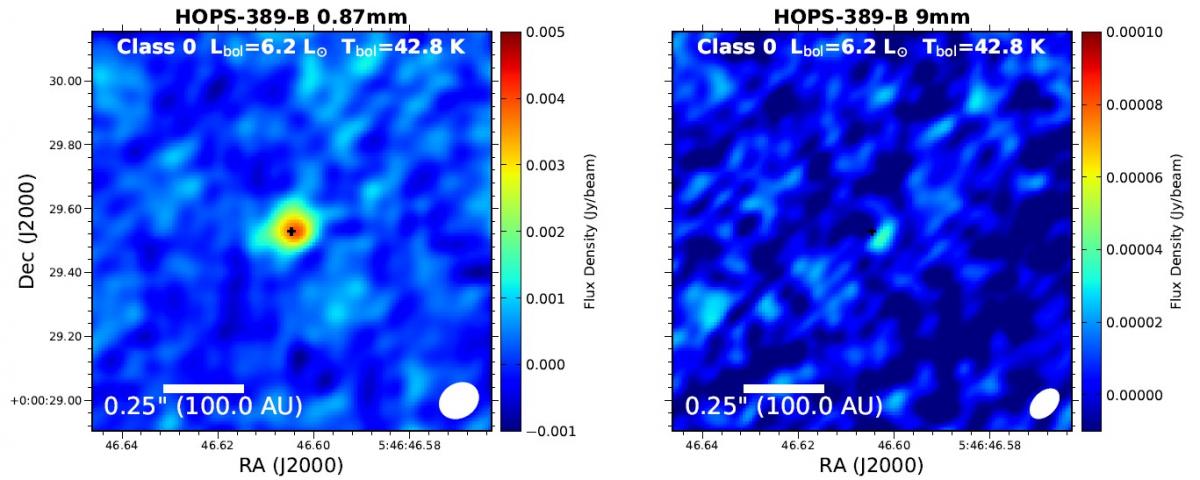
Figure 3: HOPS-389-B.
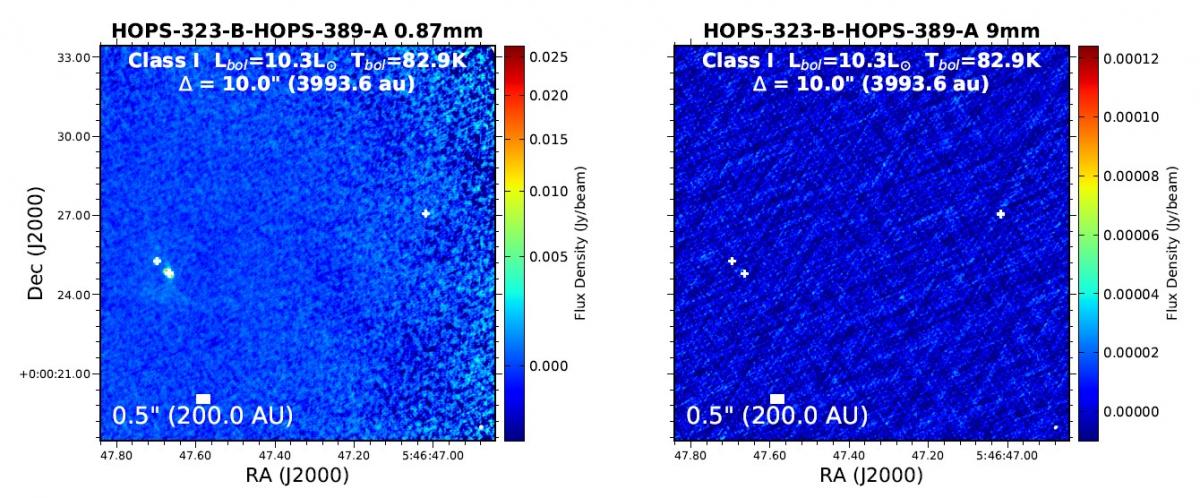
Figure 4: HOPS-323 at south east and HOPS-389-A at north west.
ACA (0.87 mm) (Federman et al. 2022).
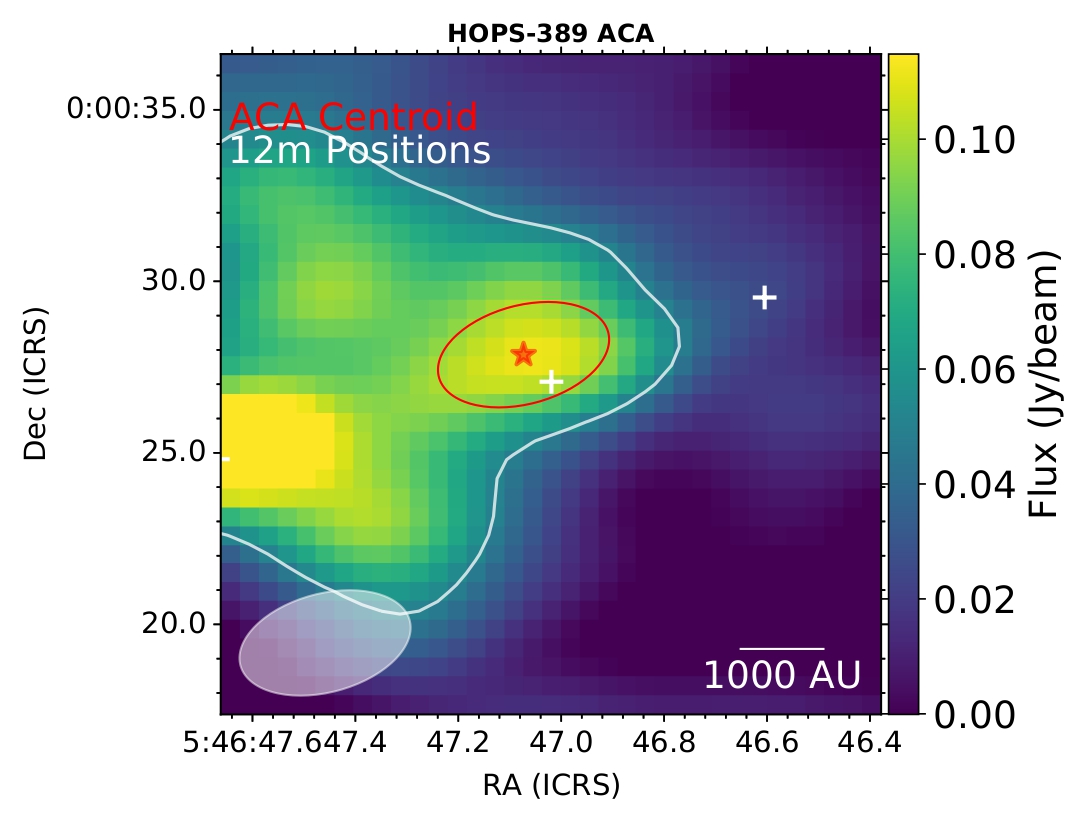
Figure 5: HOPS-389.
Scattered dust emission as observed by the HST (Habel et al. 2021 ApJ, 911, 153).

Figure 6.