
HOPS 373
|
Distance (pc) |
Zone |
|||||||
|
5.5 |
36.9 |
0 |
428.1 |
NGC 2068 |
||||
|
ALMA 0.87 mm |
||||||||
|
Source |
||||||||
|
HOPS-373-A |
05:46:31.099 |
-00:02:33.02 |
103.83 ± 1.63 |
35.34 |
0.52 |
6.6 |
0.19 x 0.17 |
135.8 |
|
HOPS-373-B |
05:46:30.905 |
-00:02:35.19 |
92.21 ± 0.95 |
60.28 |
0.39 |
3.3 |
0.1 x 0.09 |
144.3 |
|
VLA 9 mm |
||||||||
|
Source |
||||||||
|
HOPS-373-A |
05:46:31.099 |
-00:02:33.01 |
0.25 ± 0.02 |
0.144 |
7.63 |
6.6 |
0.09 x 0.06 |
1.0 |
|
HOPS-373-B |
05:46:30.905 |
-00:02:35.18 |
0.07 ± 0.01 |
0.072 |
7.53 |
3.3 |
- |
- |
|
ACA 0.87 mm |
||||||||
|
Source |
||||||||
|
HOPS-373 |
05:46:30.696 |
-00:02:35.16 |
836.04 |
315.99 |
7.0 |
- |
- |
- |
ALMA and VLA Derived Parameters
|
Source |
||||||||
|
HOPS-373-A |
69.8 ± 10.0 |
33.4 ± 10.0 |
79.2 ± 1.8 |
262.2 ± 23.8 |
4.17 |
1.53 |
2.6 ± 0.07 |
3.6 ± 0.83 |
|
HOPS-373-B |
36.0 ± 10.0 |
- |
70.3 ± 0.8 |
71.1 ± 12.8 |
5.53 |
- |
3.1 ± 0.1 |
0.9 ± 1.68 |
Sources next/close to me: -
Same source, other names: -
Source Images
Left: ALMA (0.87 mm), Right: VLA (9 mm) (Tobin et al. 2020).

Figure 1: HOPS-373-A at north east and HOPS-373-B at south east.

Figure 2: HOPS-373-A.

Figure 3: HOPS-373-B.
ACA (0.87 mm) (Federman et al. 2022).
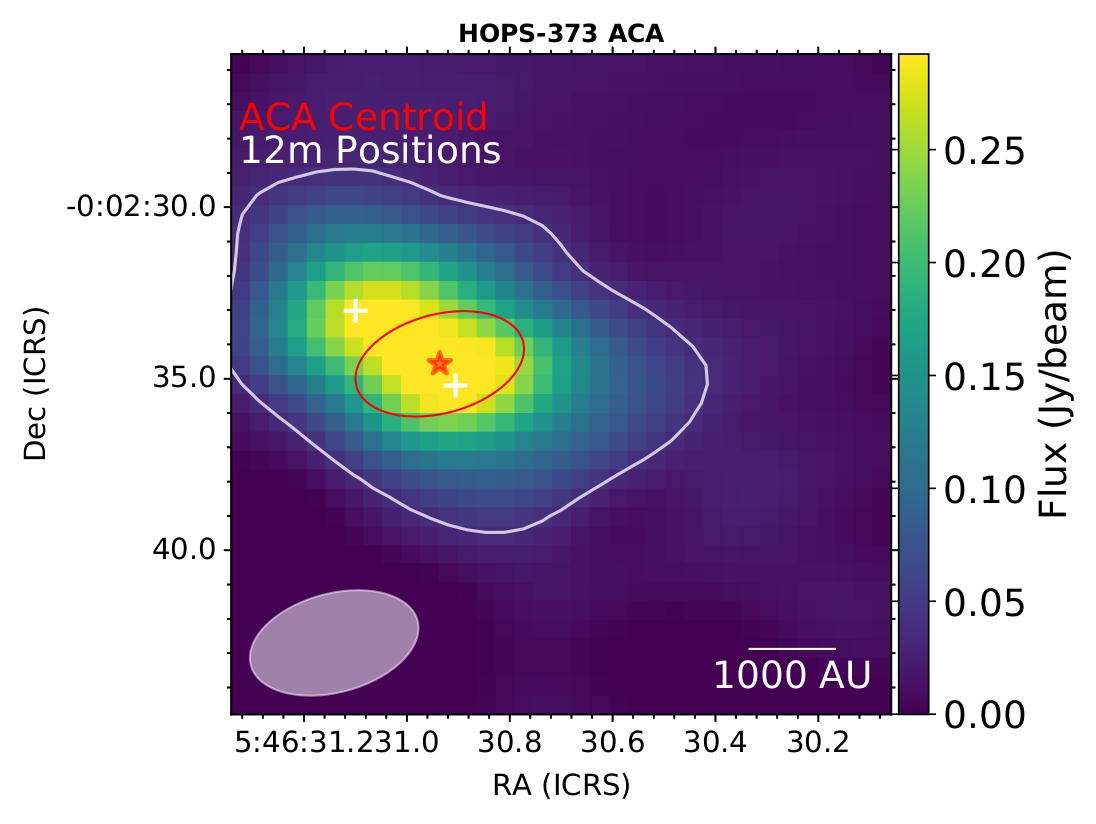
Figure 4: HOPS-373.