
HOPS 370
|
Distance (pc) |
Zone |
|||||||
|
315.7 |
71.5 |
I |
392.8 |
OMC 2 |
||||
|
ALMA 0.87 mm |
||||||||
|
Source |
||||||||
|
HOPS-370 |
05:35:27.634 |
-05:09:34.42 |
533.29 ± 10.05 |
109.89 |
1.99 |
1.0 |
0.34 x 0.11 |
109.7 |
|
VLA 9 mm |
||||||||
|
Source |
||||||||
|
HOPS-370 |
05:35:27.633 |
-05:09:34.40 |
2.84 ± 0.02 |
1.93 |
7.3 |
1.0 |
0.08 x 0.03 |
5.6 |
|
ACA 0.87 mm |
||||||||
|
Source |
||||||||
|
HOPS-370 |
05:35:27.624 |
-05:09:33.48 |
1296.07 |
818.9 |
12.12 |
- |
- |
- |
ALMA and VLA Derived Parameters
|
Source |
||||||||
|
HOPS-370 |
112.8 ± 10.0 |
28.0 ± 10.0 |
114.6 ± 2.2 |
916.5 ± 5.8 |
0.85 |
0.16 |
2.2 ± 0.06 |
0.7 ± 0.05 |
Sources next/close to me: 2MASSJ05352746-0509441
Same source, other names: FIR3, VLA-11, MIPS 2302, MIR 21.
Source Images
Left: ALMA (0.87 mm), Right: VLA (9 mm) (Tobin et al. 2020).
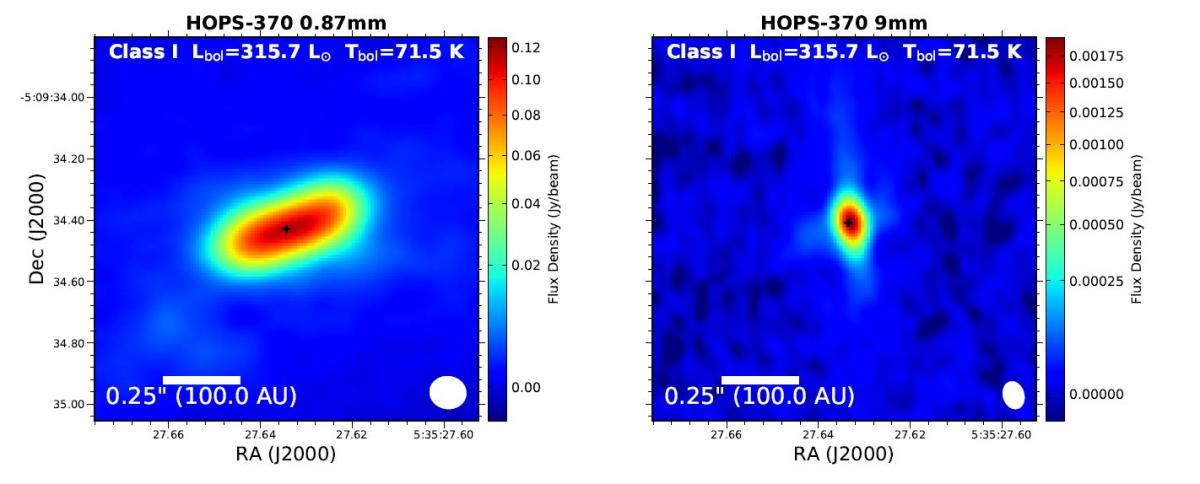
Figure 1: HOPS-370.
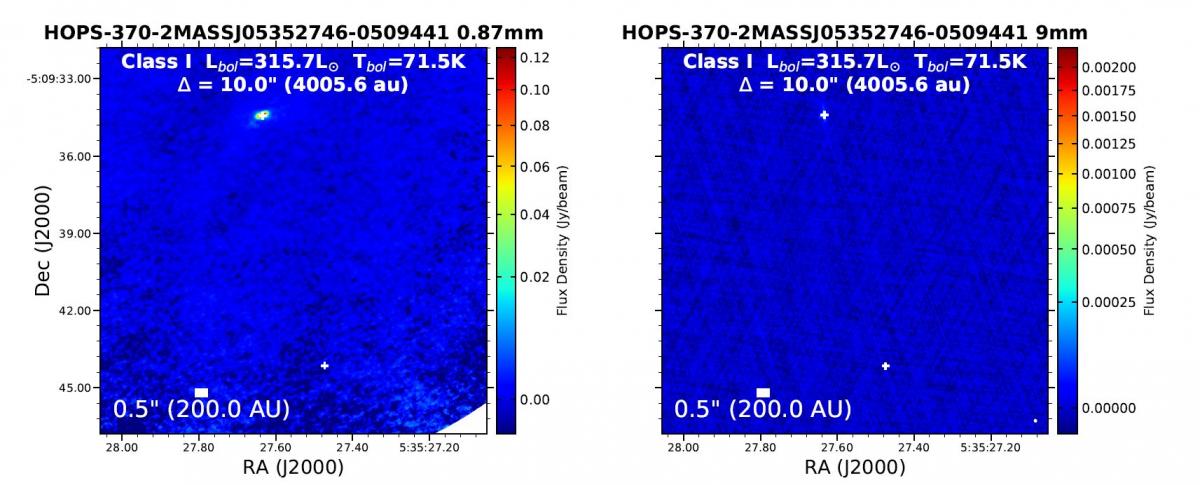
Figure 2: At north east HOPS-370 and south west 2MASSJ05352746-0509441.
ACA (0.87 mm) (Federman et al. 2022).
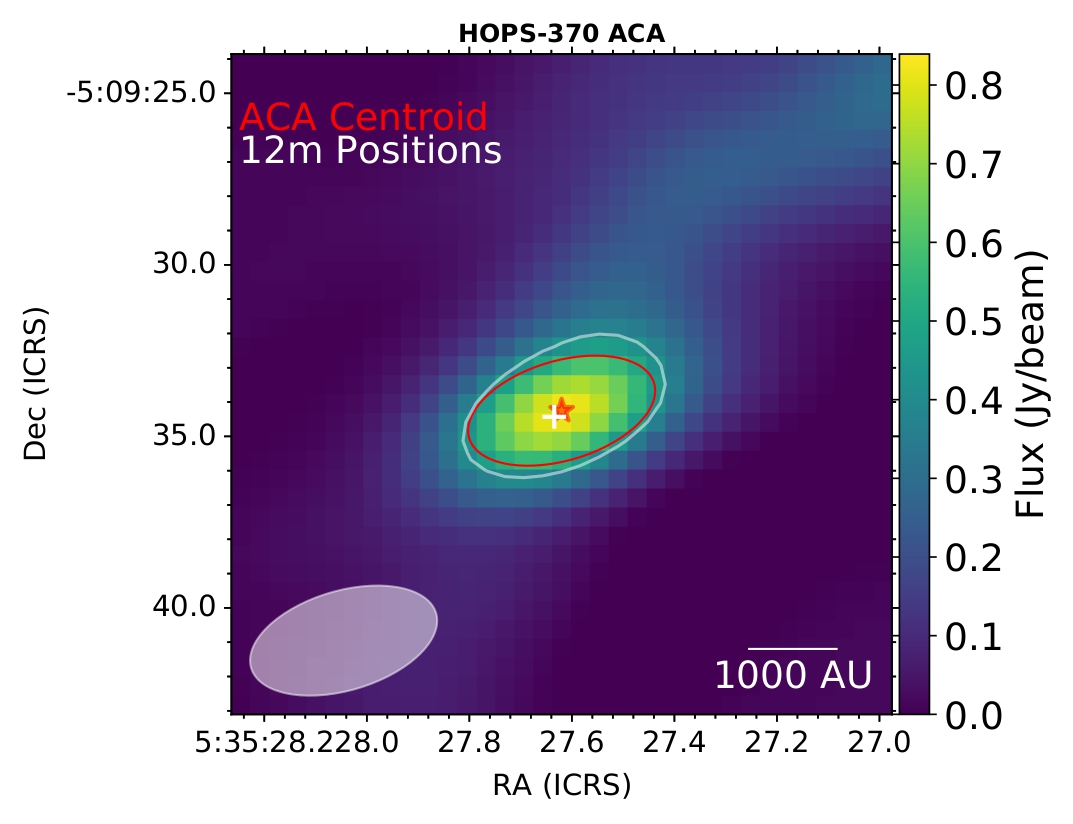
Figure 3: HOPS-370.
VLA 11
| RA(J2000) | DEC(J2000) | Spectral Index |
Nature Evolved Stage |
Other Names | ||||||
| 5 cm | 3 cm | 1.3 cm | 0.9 cm | 0.7 cm | ||||||
| 05:35:27.6337 ± 0.0007 | -05:09:34.368 ± 0.011 | 50 ± 50 | 1.76 ± 0.18 | 2.16 ± 0.22 | 2.6 ± 0.3 | 2.6 ± 0.3 | 4.0 ± 0.4 | 0.27 ± 0.10 | Class I | FIR 3, MIPS 2302, MIR 21, HOPS 370 |
VLA (5 cm, black contours) (Osorio et al. 2017).
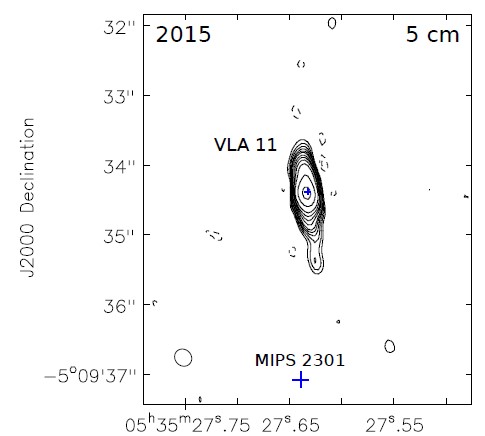
Figure 4: VLA 11 (5 cm detection).
VLA (3.6 cm, black contours) (Osorio et al. 2017).
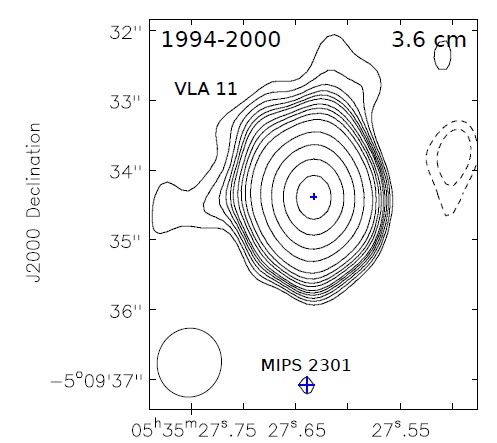
Figure 5: VLA 11 (3.6 cm detection).
VLA 12
| Source Name | RA(J2000) | DEC(J2000) | Spectral Index |
Nature Evolved Stage |
||||||
| 5 cm | 3 cm | 1.3 cm | 0.9 cm | 0.7 cm | ||||||
| VLA 12N | 05:35:27.385 ± 0.011 | -05:09:50.68 ± 0.16 | 155 ± 12 | 0.134 ± 0.020 | 0.073 ± 0.014 | < 0.03 | < 0.025 | < 0.05 | -1.07 ± 0.07 | Jet Knot of VLA 11 |
| VLA 12C | 05:35:27.111 ± 0.012 | -05:09:58.57 ± 0.18 | 192 ± 6 | 0.24 ± 0.03 | 0.09 ± 0.03 | < 0.03 | < 0.024 | < 0.04 | -1.3 ± 0.4 | Jet Knot of VLA 11 |
| VLA 12S | 05:35:26.9389 ± 0.0017 | -05:10:02.876 ± 0.025 | 233 ± 10 | 0.25 ± 0.03 | 0.192 ± 0.024 | 0.16 ± 0.03 | 0.137 ± 0.020 | < 0.04 | -0.59 ± 0.20 | Jet Knot of VLA 11 |
Left: VLA (3.6 cm), Right: VLA (5 cm) (Osorio et al. 2017).
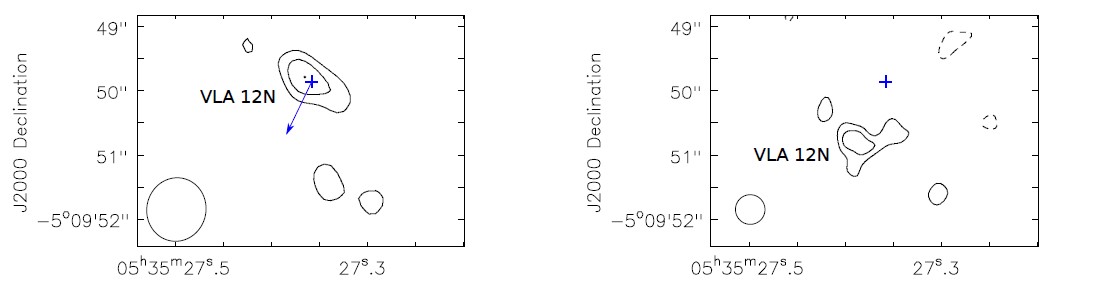
Figure 6: VLA 12N jet knot of VLA 11 (HOPS-370).
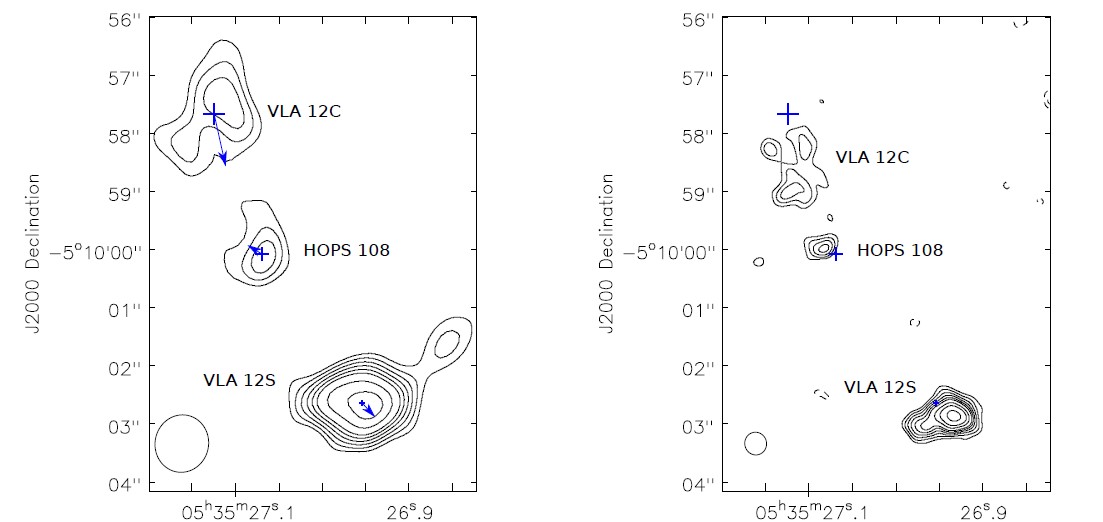
Figure 7: VLA 12C and VLA 12S jet knot of VLA 11 (HOPS-370).
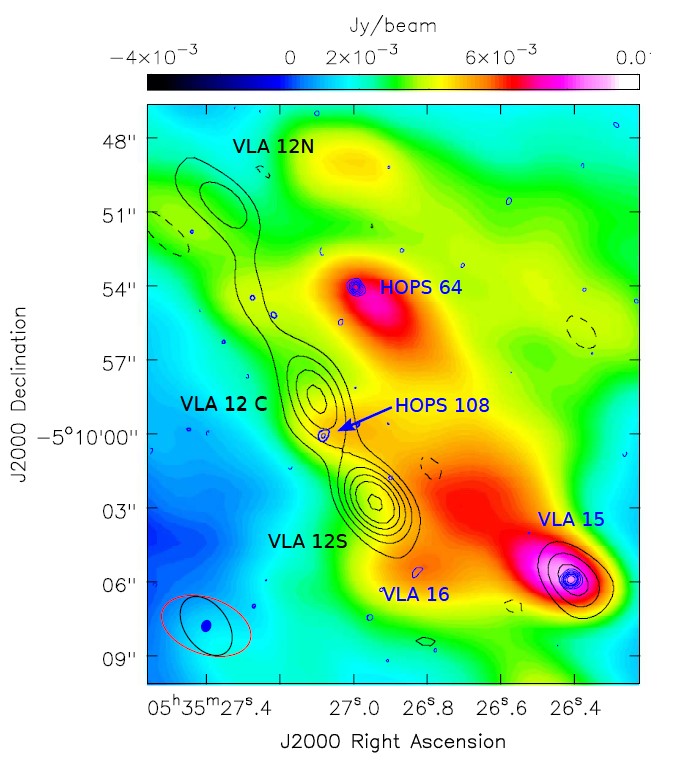
Figure 8: VLA 12N, VLA 12C and VLA 12S jet knots from VLA 11 or HOPS-370. ALMA image of the dust emission at 3 mm (color scale, Kainulainen et al. 2017) overlaid on
the VLA maps at 3 cm (black contours) and 0.7 cm (blue contours, see Figure 8).
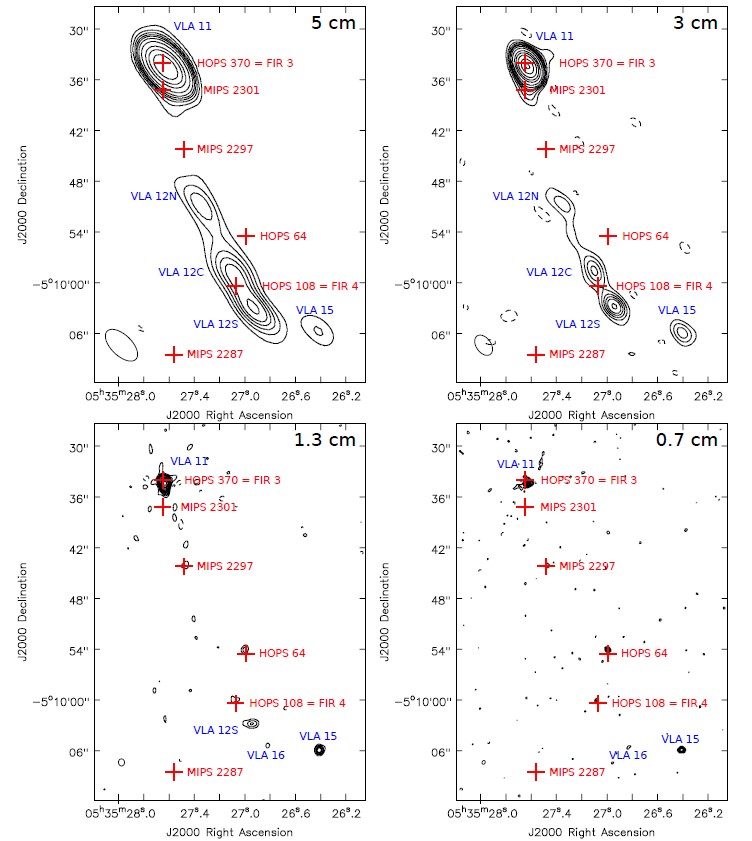
Figure 9: Sources maps of the region around HOPS-108.
Scattered dust emission as observed by the HST (Habel et al. 2021 ApJ, 911, 153).

Figure 10.