
HOPS 361
|
Distance (pc) |
Zone |
|||||||
|
503.1 |
69.0 |
0 |
430.4 |
NGC 2068 |
||||
|
ALMA 0.87 mm |
||||||||
|
Source |
||||||||
|
HOPS-361-A |
05:47:04.783 |
00:21:42.86 |
606.35 ± 6.28 |
148.914 |
0.26 |
0.1 |
0.26 x 0.15 |
14.4 |
|
HOPS-361-B |
05:47:04.755 |
00:21:45.45 |
94.38 ± 2.56 |
78.129 |
1.32 |
2.6 |
0.06 x 0.05 |
174.4 |
|
HOPS-361-C |
05:47:04.631 |
00:21:47.85 |
883.40 ± 9.15 |
99.369 |
1.61 |
5.4 |
0.47 x 0.19 |
130.1 |
|
HOPS-361-D |
05:47:04.317 |
00:21:38.04 |
71.26 ± 4.34 |
29.469 |
2.33 |
8.4 |
0.17 x 0.09 |
43.1 |
|
HOPS-361-E |
05:47:04.624 |
00:21:41.30 |
29.40 ± 4.23 |
14.343 |
1.33 |
2.8 |
0.15 x 0.11 |
111.9 |
|
HOPS-361-F |
05:47:04.967 |
00:21:40.74 |
6.63 ± 1.24 |
5.763 |
1.39 |
3.6 |
- |
- |
|
HOPS-361-G-A |
05:47:05.367 |
00:21:50.53 |
31.59 ± 1.24 |
27.55 |
4.54 |
11.7 |
- |
- |
|
HOPS-361-G-B |
05:47:05.451 |
00:21:50.08 |
18.99 ± 1.24 |
15.46 |
5.5 |
12.4 |
- |
- |
|
HOPS-361-H |
- |
- |
- |
- |
- |
- |
- |
- |
|
HOPS-361-I |
- |
- |
- |
- |
- |
- |
- |
- |
|
HOPS-361-J |
- |
- |
- |
- |
- |
- |
- |
- |
|
VLA 9 mm |
||||||||
|
Source |
||||||||
|
HOPS-361-A |
05:47:04.784 |
00:21:42.85 |
5.45 ± 0.03 |
3.007 |
8.8 |
0.1 |
0.1 x 0.07 |
64.4 |
|
HOPS-361-B |
05:47:04.755 |
00:21:45.45 |
1.76 ± 0.02 |
1.287 |
8.83 |
2.6 |
0.07 x 0.04 |
55.5 |
|
HOPS-361-C-A |
05:47:04.631 |
00:21:47.82 |
2.21 ± 0.02 |
1.312 |
8.9 |
5.4 |
0.14 x 0.04 |
6.7 |
|
HOPS-361-C-B |
05:47:04.625 |
00:21:47.88 |
0.38 ± 0.01 |
0.651 |
8.9 | 5.5 |
- |
- |
|
HOPS-361-D |
05:47:04.317 |
00:21:38.03 |
0.30 ± 0.02 |
0.187 |
9.05 |
8.4 |
0.09 x 0.06 |
50.9 |
|
HOPS-361-E |
05:47:04.623 |
00:21:41.30 |
0.15 ± 0.02 |
0.101 |
8.83 |
2.7 |
- |
- |
|
HOPS-361-F |
05:47:04.967 |
00:21:40.74 |
0.09 ± 0.01 |
0.089 |
8.85 |
3.6 |
- |
- |
|
HOPS-361-G-A |
05:47:05.367 |
00:21:50.51 |
0.46 ± 0.02 |
0.308 |
9.3 |
11.7 |
0.09 x 0.06 |
44.3 |
|
HOPS-361-G-B |
05:47:05.451 |
00:21:50.08 |
0.28 ± 0.02 |
0.212 |
9.4 |
12.4 |
0.07 x 0.04 |
13.3 |
|
HOPS-361-H |
05:47:05.125 |
00:22:01.46 |
0.28 ± 0.02 |
0.185 |
10.22 |
19.3 |
0.08 x 0.06 |
18.0 |
|
HOPS-361-I |
05:47:04.246 |
00:21:22.7 |
0.13 ± 0.01 |
0.118 |
10.63 |
21.7 |
- |
- |
|
HOPS-361-J |
05:47:04.525 |
00:21:23.89 |
0.10 ± 0.01 |
0.096 |
10.23 |
19.3 |
- |
- |
|
ACA 0.87 mm |
||||||||
|
Source |
||||||||
|
HOPS-361 |
05:47:04.776 |
+00:21:42.84 |
3868.24 |
1247.13 |
23.94 |
- |
- |
- |
ALMA and VLA Derived Parameters
|
Source |
||||||||
|
HOPS-361-A |
96.1 ± 10.0 |
36.9 ± 10.0 |
138.6 ± 1.4 |
1876.5 ± 9.0 |
0.65 |
0.07 |
2.0 ± 0.06 |
0.6 ± 0.04 |
|
HOPS-361-B |
20.5 ± 10.0 |
27.1 ± 10.0 |
21.6 ± 0.6 |
605.1 ± 6.9 |
6.06 |
0.22 |
1.7 ± 0.06 |
1.0 ± 0.09 |
|
HOPS-361-C-A |
173.6 ± 10.0 |
49.3 ± 10.0 |
201.9 ± 2.7 |
760.5 ± 8.5 |
0.375 |
0.159 |
2.6 ± 0.06 |
0.2 ± 0.08 |
|
HOPS-361-C-B |
- |
- |
- |
130.2 ± 2.8 |
- |
- |
- |
3.7 ± 0.18 |
|
HOPS-361-D |
63.6 ± 10.0 |
34.0 ± 10.0 |
16.3 ± 1.9 |
104.4 ± 8.5 |
6.15 |
1.23 |
2.3 ± 0.07 |
2.2 ± 0.7 |
|
HOPS-361-E |
53.4 ± 11.0 |
- |
6.7 ± 1.0 |
50.3 ± 6.9 |
15.585 |
- |
2.3 ± 0.10 |
2.3 ± 1.09 |
|
HOPS-361-F |
- |
- |
1.5 ± 0.3 |
32.4 ± 2.8 |
- |
- |
1.8 ± 0.11 |
2.6 ± 0.70 |
|
HOPS-361-G-A |
- |
33.3 ± 10.0 |
7.2 ± 1.0 |
159.5 ± 8.4 |
- |
0.809 |
1.8 ± 0.07 |
0.2 ± 0.41 |
|
HOPS-361-G-B |
- |
25.2 ± 10.0 |
4.3 ± 1.2 |
98.2 ± 7.3 |
- |
1.378 |
1.8 ± 0.07 |
1.3 ± 0.58 |
|
HOPS-361-H |
- |
30.3 ± 10.0 |
- |
95.1 ± 8.8 |
- |
1.379 |
- |
2.7 ± 0.71 |
|
HOPS-361-I |
- |
- |
- |
44.4 ± 3.3 |
- |
- |
- |
9.8 ± 1.22 |
|
HOPS-361-J |
- |
- |
- |
35.8 ± 3.2 |
- |
- |
- |
11.3 ± 1.96 |
Sources next/close to me: -
Same source, other names: IRS 1/2/3 and VLA 1 from Carrasco-González (2012).
Source Images
Left: ALMA (0.87 mm), Right: VLA (9 mm) (Tobin et al. 2020).
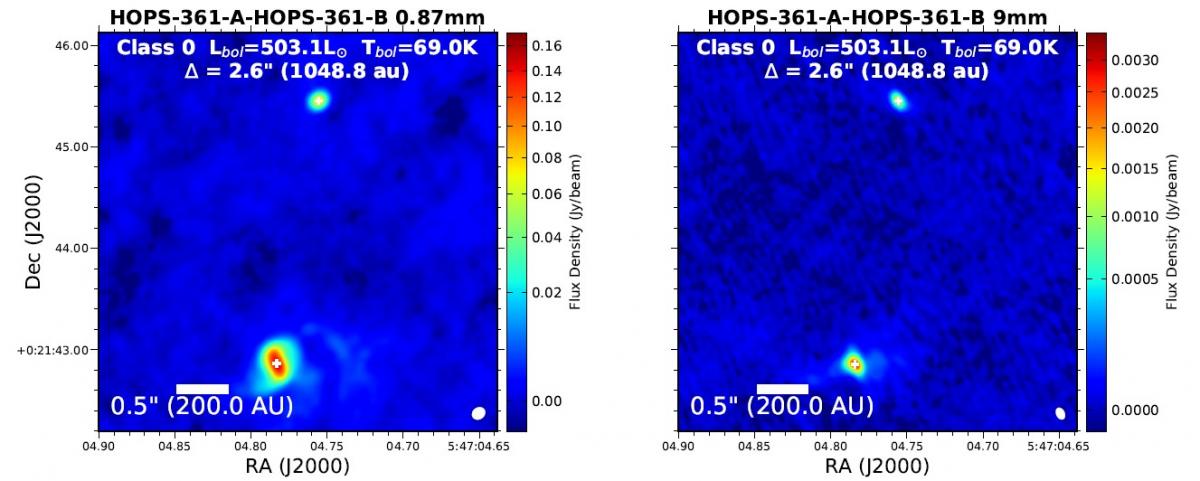
Figure 1: HOPS-361-A at south east and HOPS-361-B at north west.
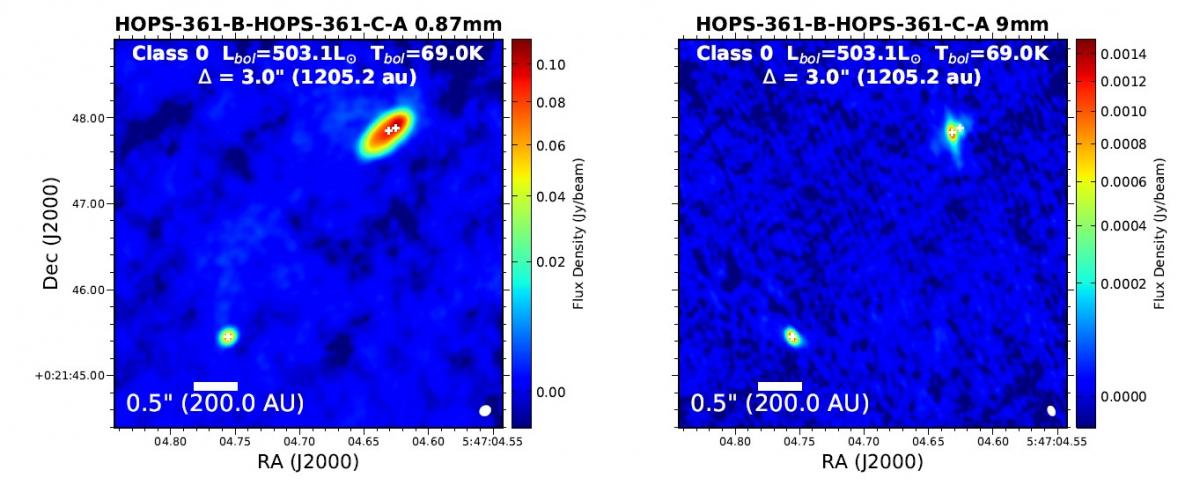
Figure 2: HOPS-361-B at south east and HOPS-361-C-A at north west.
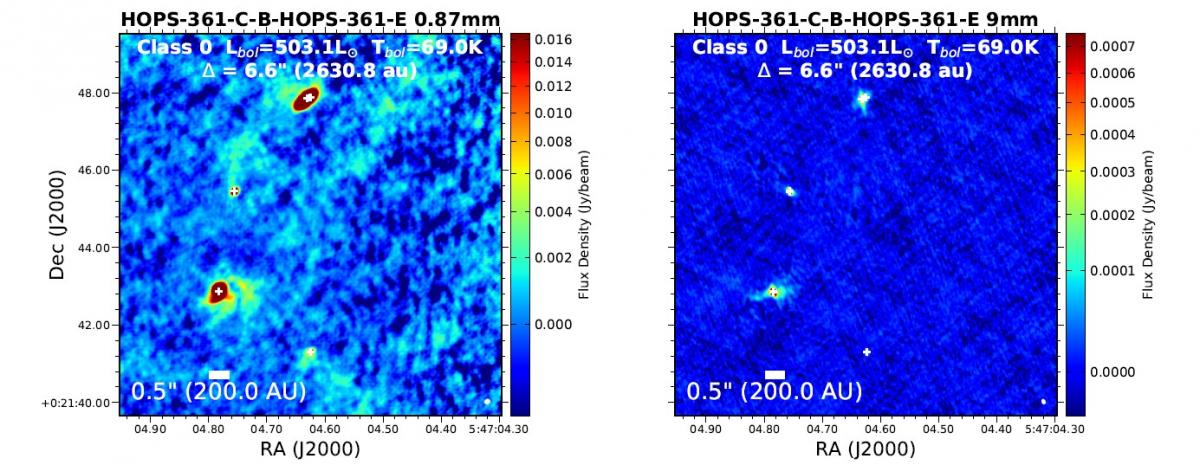
Figure 3: HOPS-361-E at south, HOPS-361-C-A at north, HOPS-361-B at north east (close to the center) and HOPS-361-A at south east (close to the center).
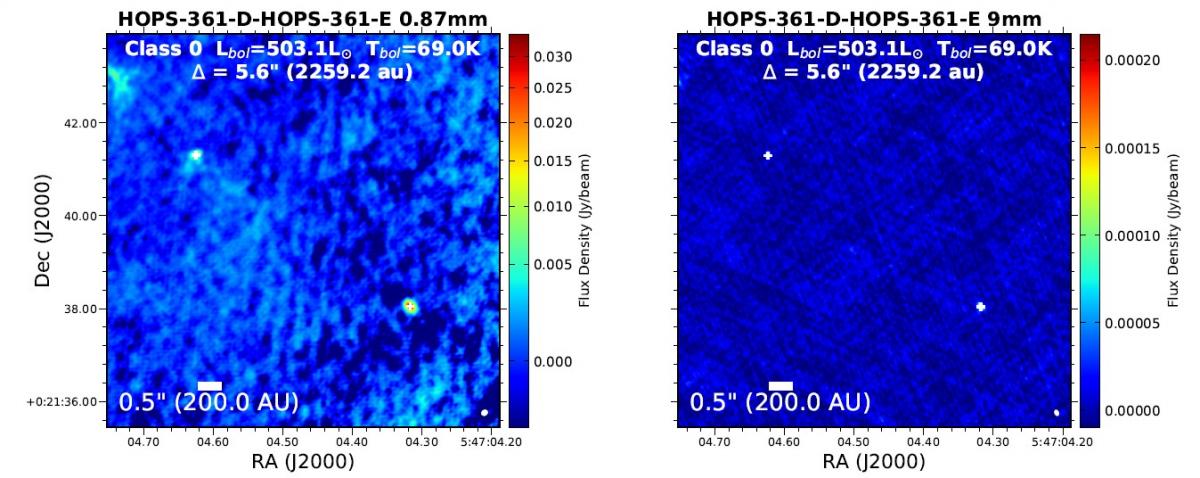
Figure 4: HOPS-361-D at south west and HOPS-361-E at north east.
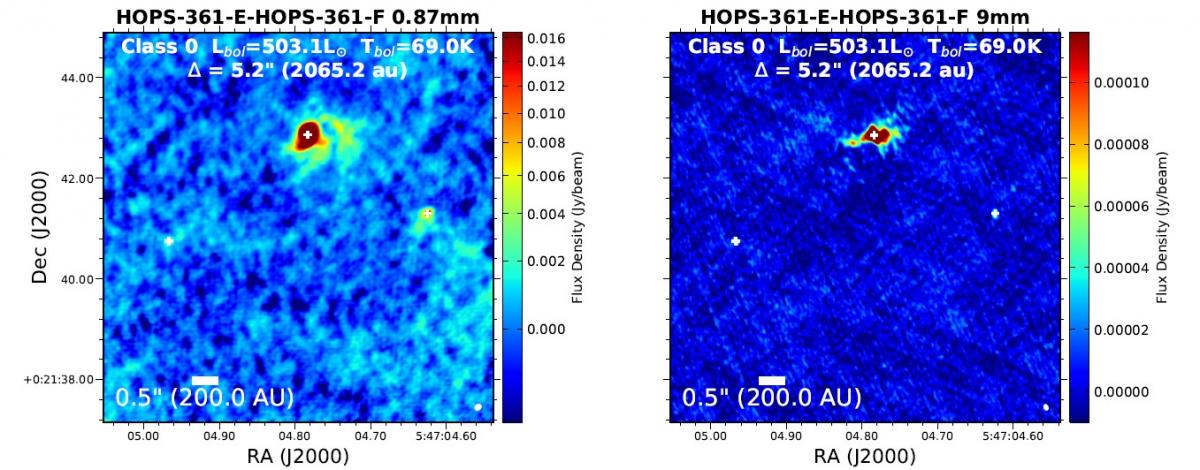
Figure 5: HOPS-361-E at south west and HOPS-361-F at south east.
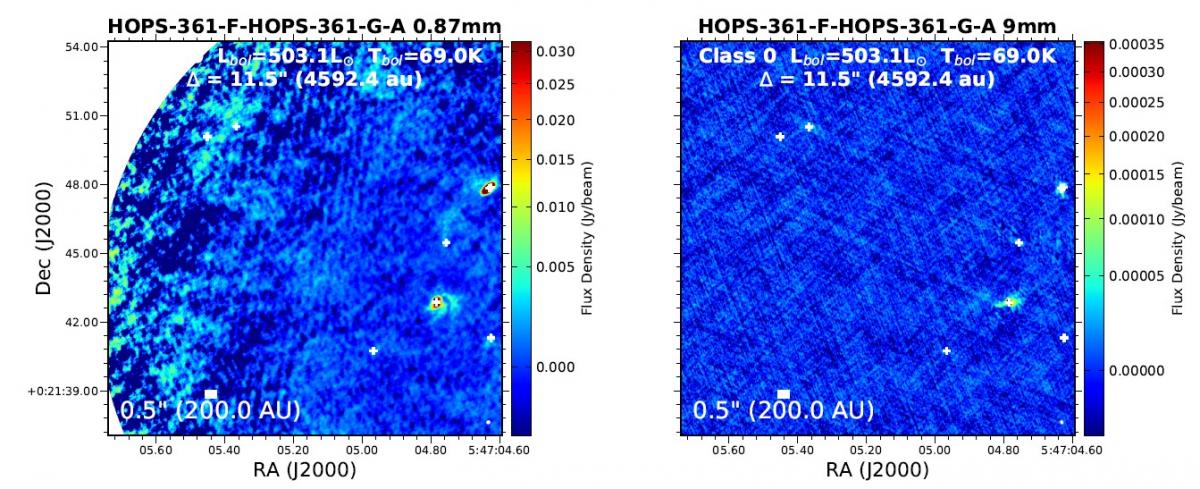
Figure 6: HOPS-361-F at south east (close to the center) and HOPS-361-G at north west.
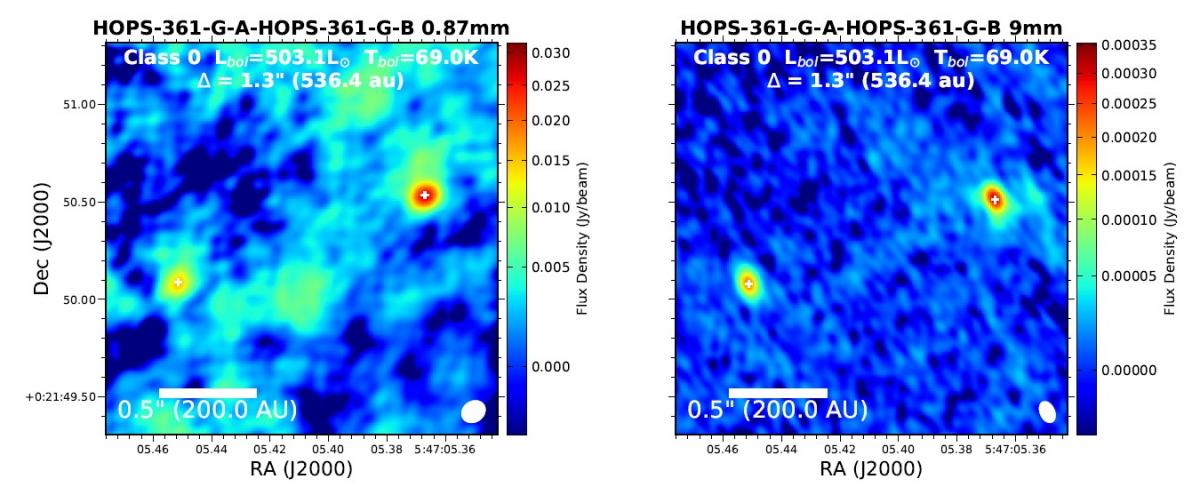
Figure 7: HOPS-361-G-A at north west and HOPS-361-G-B at south east.
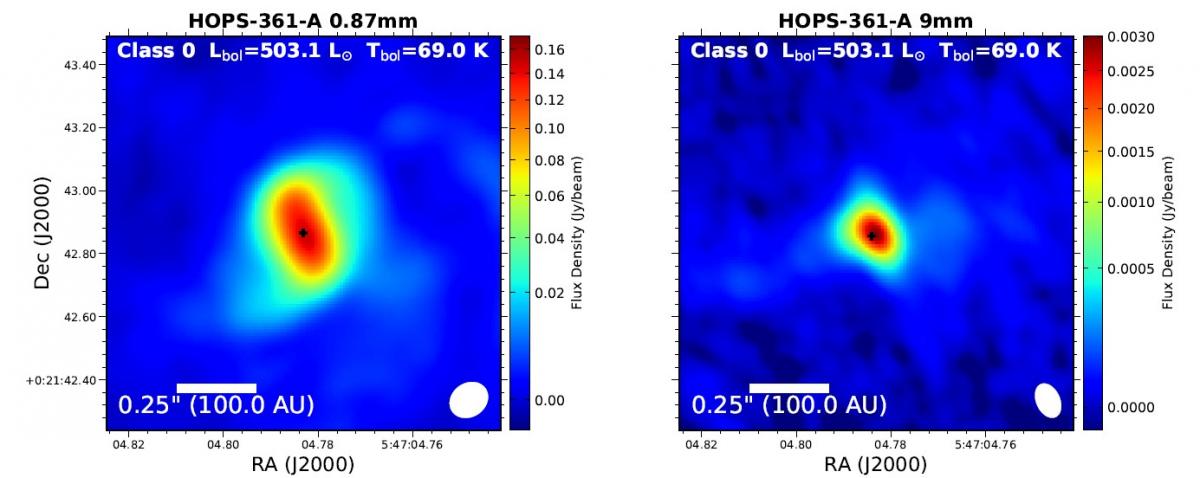
Figure 8: HOPS-361-A.
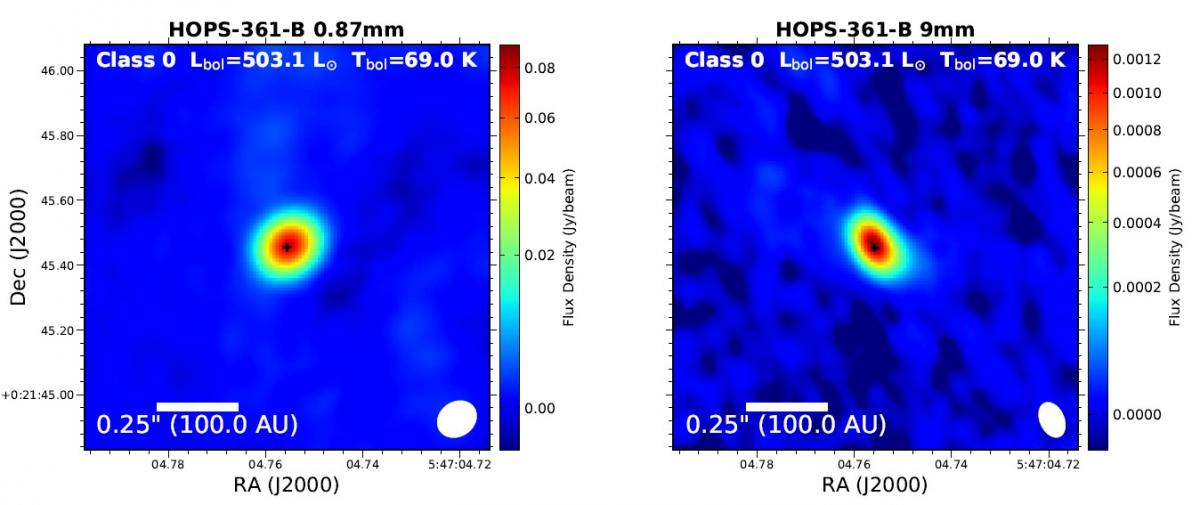
Figure 9: HOPS-361-B.
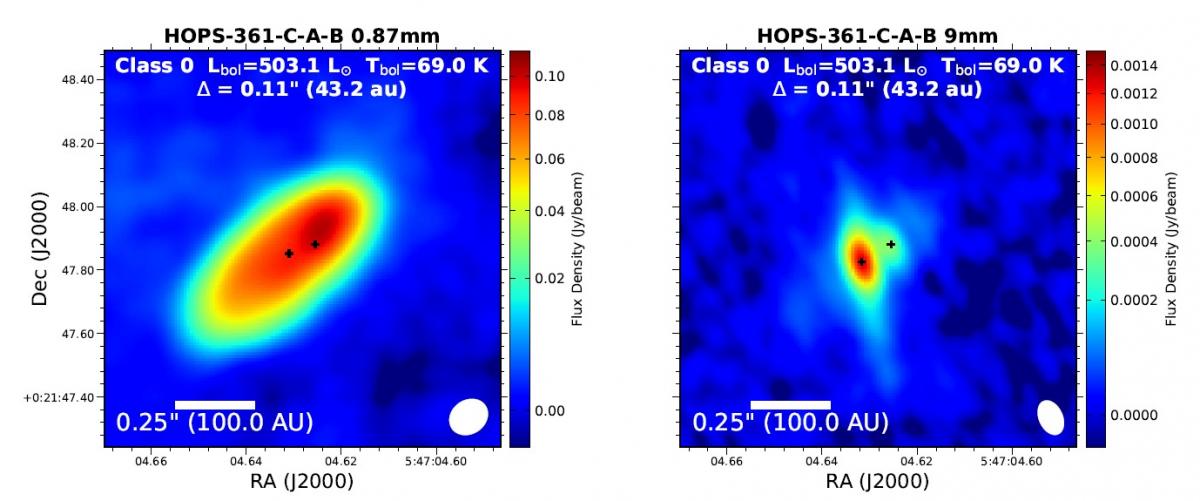
Figure 10: HOPS-361-C-A-B.
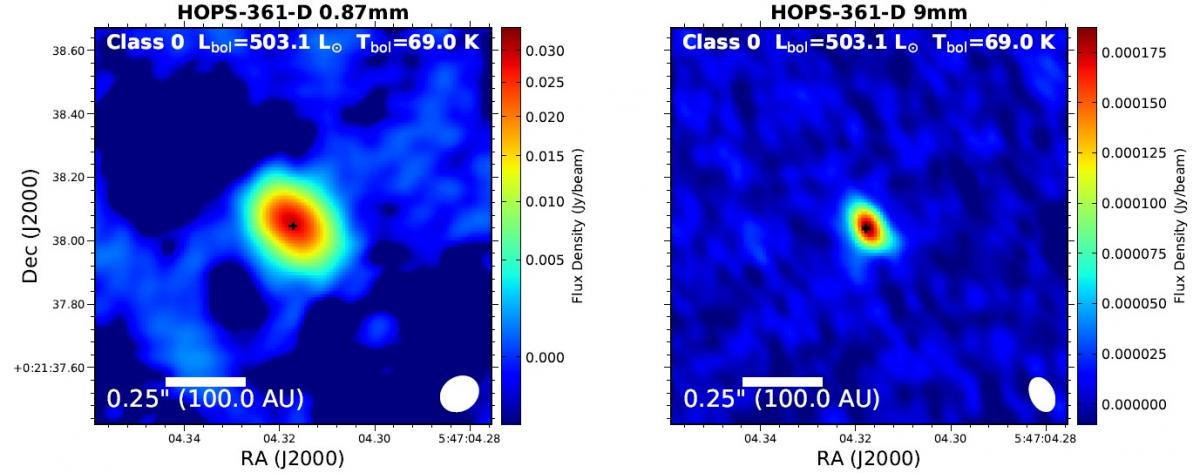
Figure 11: HOPS-361-D.
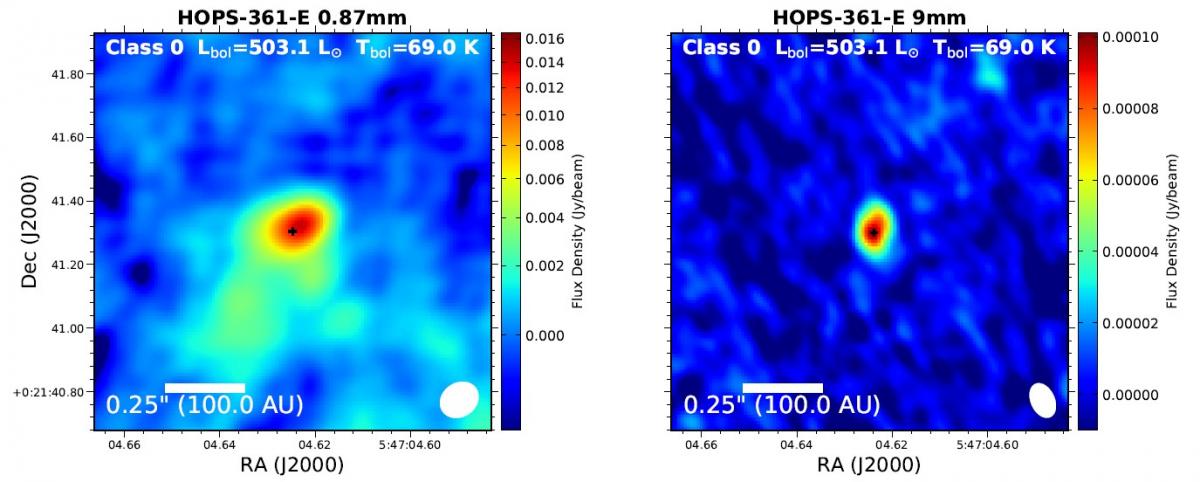
Figure 12: HOPS-361-E.
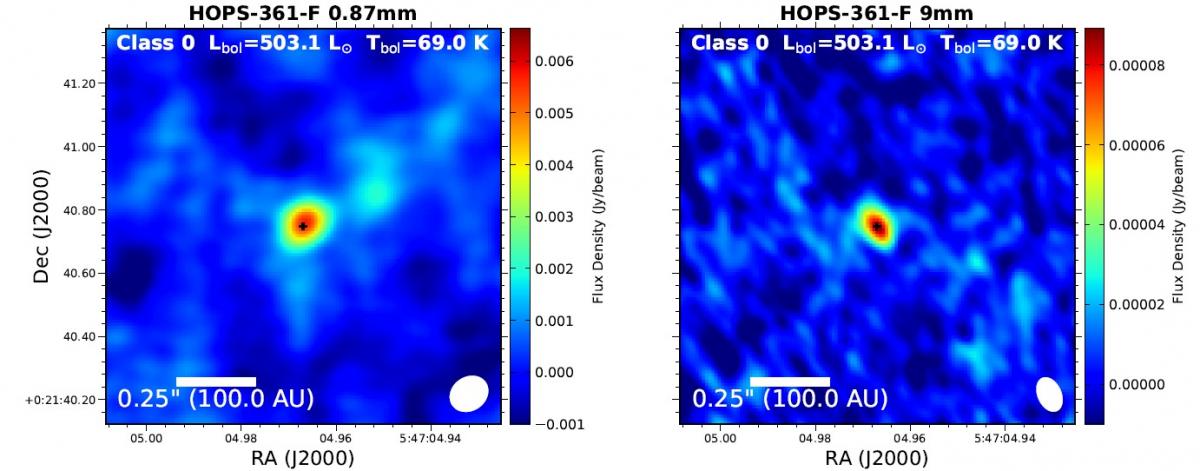
Figure 13: HOPS-361-F.
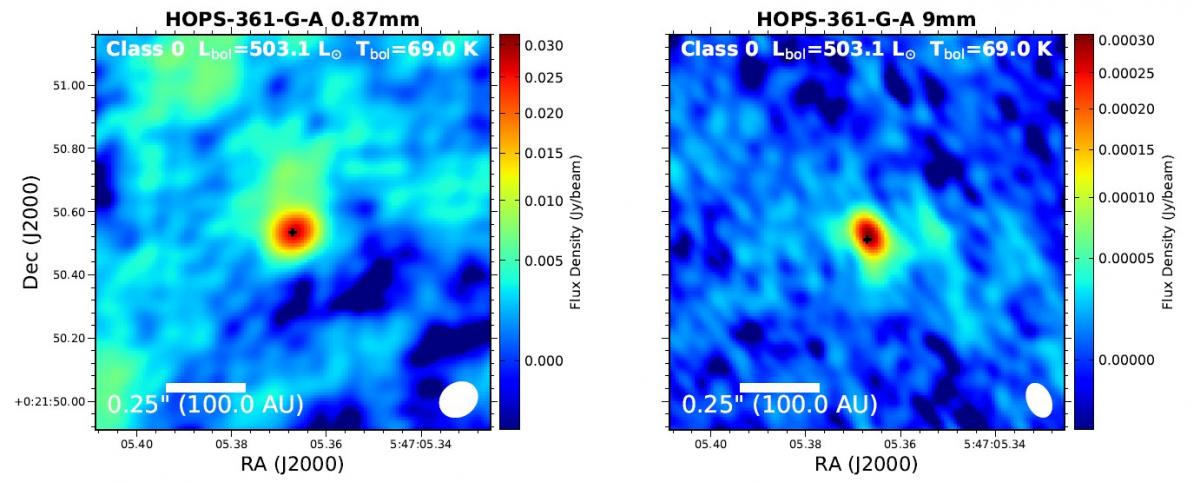
Figure 14: HOPS-361-G-A.
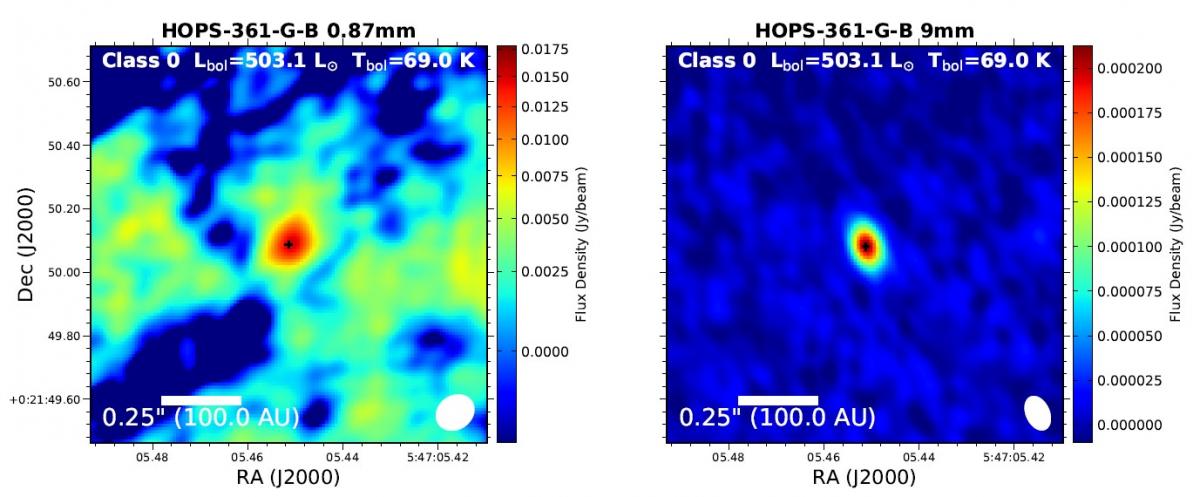
Figure 15: HOPS-361-G-B.
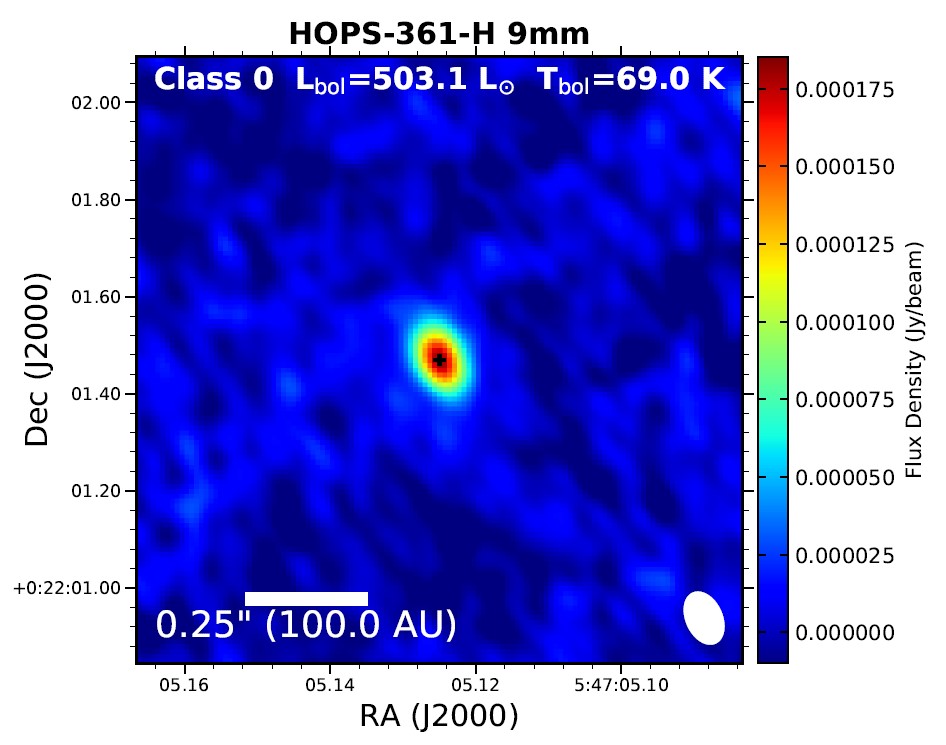
Figure 16: HOPS-361-H.
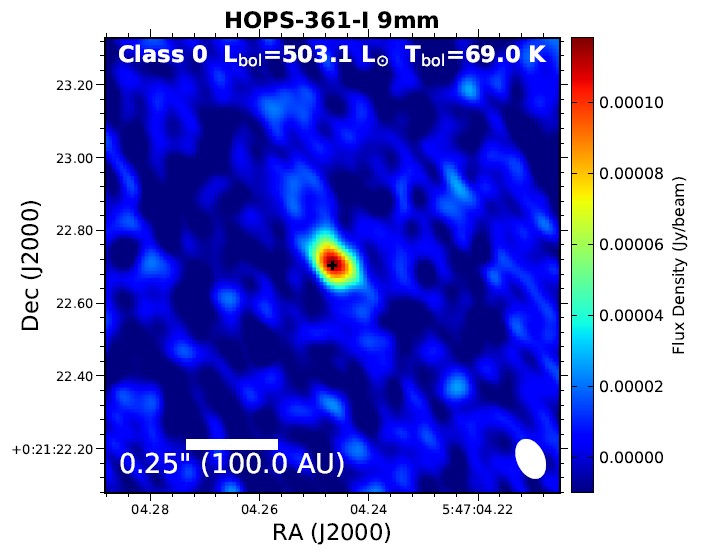
Figure 17: HOPS-361-I.
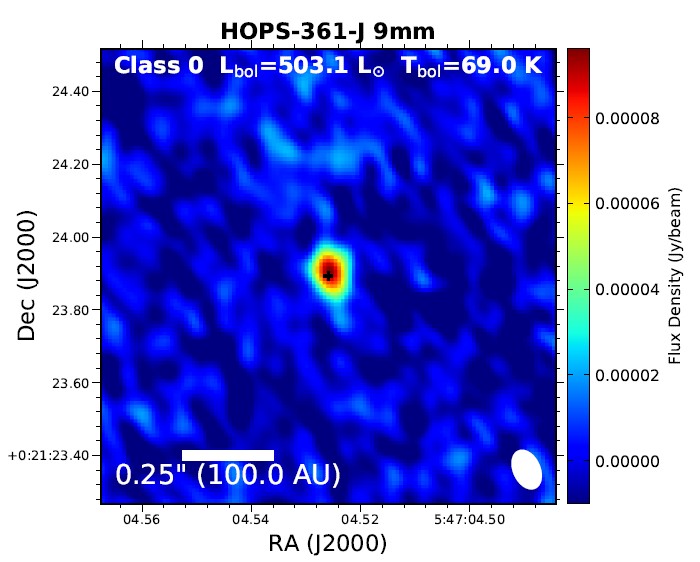
Figure 18: HOPS-361-J.
ACA (0.87 mm) (Federman et al. 2022).
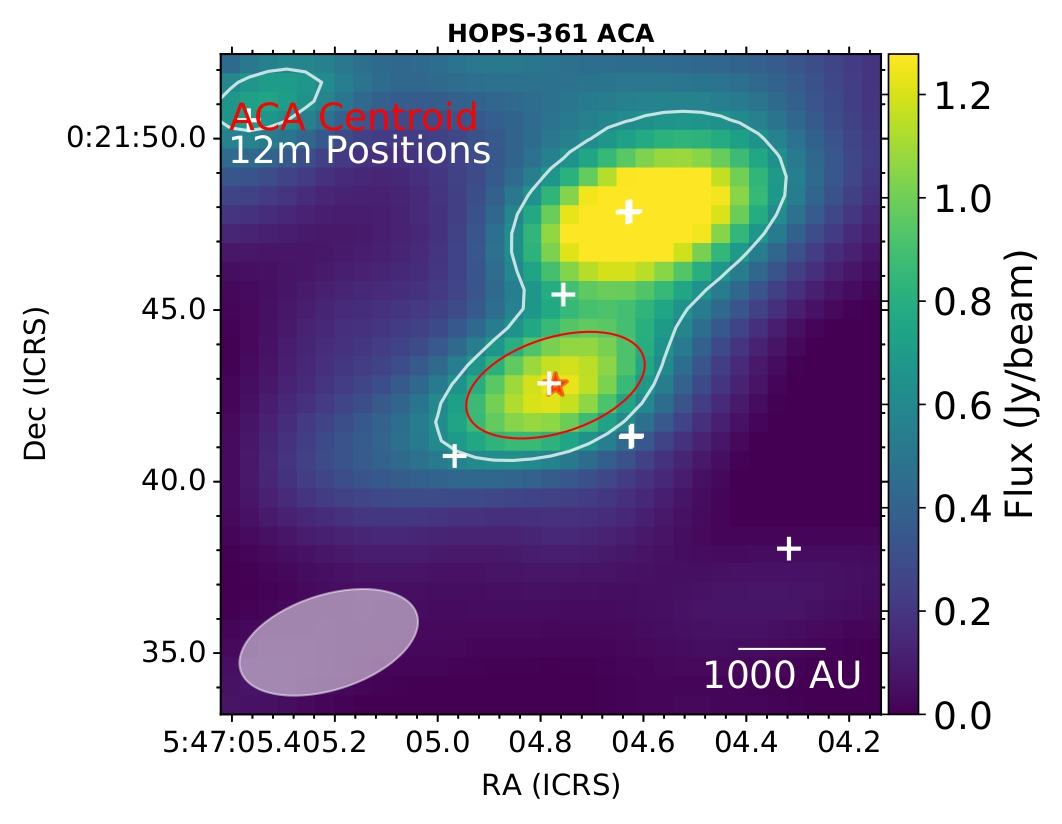
Figure 19: HOPS-61.
VLA deteccion from Carrasco-González (2012).
Flux Density (mJy)
| Wavelength | IRS 1/HOPS-361-A | IRS 2A/HOPS-361-G-A | IRS 2B/HOPS-361-G-B | IRS 3/HOPS-361-C-A | VLA 1/HOPS-361-B |
| 20 cm | 4.0 ± 0.2 | < 0.5 | < 0.5 | 1.3 ± 0.2 | < 0.5 |
| 6 cm | 6.4 ± 0.3 | 0.5 ± 0.1 | 0.5 ± 0.1 | 2.2 ± 0.2 | 0.34 ± 0.08 |
| 3.6 cm | 7.7 ± 0.9 | 0.42 ± 0.05 | 0.25 ± 0.06 | 2.9 ± 0.2 | 0.34 ± 0.07 |
| 2 cm | 11.0 ± 3.0 | < 0.4 | < 0.4 | > 2.2 | 0.5 ± 0.2 |
| 1.3 cm | 14.0 ± 2.0 | < 1.0 | < 1.0 | 4.8 ± 0.8 | 0.9 ± 0.3 |
| 3 mm (A)* | 36.0 ± 1.0 | 5.0 ± 1.0 | 5.0 ± 1.0 | 42.0 ± 1.0 | 9.0 ± 1.0 |
| 3 mm (B)* | 23.0 ± 1.0 | < 2 | < 2 | 35.0 ± 1.0 | 6.0 ± 1.0 |
*VLA Configuration (A or B).
Source Images
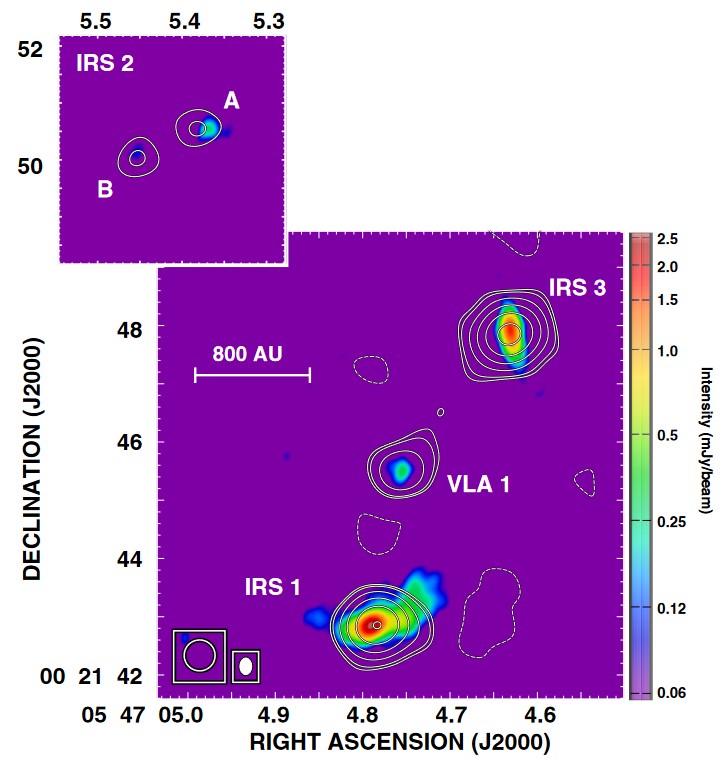
Figure 20: Superposition of the B configuration CARMA 3 mm continuum
emission map (contours) over the A configuration VLA 3.6 cm continuum
emission map (colors) of the NGC 2071 region. The 3.6 cm map was made by
concatenating the UV data from the five epochs. The rms of the 3.6 cm map is
19 μJy beam−1. Contours are −3, 3, 4, 8, 16, 32, and 64 times the rms of the
3 mm map, 370 μJy beam−1. Both maps were made using natural weighting.
Beam sizes are indicated in the lower left corner, with the filled ellipse showing
that of the VLA data (Figure 1 from Carrasco-González (2012)).
Scattered dust emission as observed by the HST (Habel et al. 2021 ApJ, 911, 153).

Figure 21.