
HOPS 355
|
Distance (pc) |
Zone |
|||||||
|
1.0 |
44.9 |
0 |
385.8 |
LDN 1641 |
||||
|
ALMA 0.87 mm |
||||||||
|
Source |
||||||||
|
HOPS-355 |
05:37:17.123 |
-06:49:49.12 |
16.26 ± 0.65 |
11.23 |
0.27 |
0.7 |
0.08 x 0.07 |
6.4 |
|
VLA 9 mm |
||||||||
|
Source |
||||||||
|
HOPS-355 |
05:37:17.123 |
-06:49:49.13 |
0.11 ± 0.02 |
0.09 |
8.7 |
0.7 |
0.07 x 0.04 |
127.1 |
|
ACA 0.87 mm |
||||||||
|
Source |
||||||||
|
HOPS-355 |
05:37:17.088 |
-06:49:49.44 |
231.73 |
71.0 |
2.82 |
- |
- |
- |
ALMA and VLA Derived Parameters
|
Source |
||||||||
|
HOPS-355 |
26.2 ± 10.0 |
23.3 ± 10.8 |
16.6 ± 0.7 |
152.0 ± 24.0 |
41.46 |
4.35 |
2.1 ± 0.09 |
3.4 ± 1.42 |
Sources next/close to me: -
Same source, other names: -
Source Images
Left: ALMA (0.87 mm), Right: VLA (9 mm) (Tobin et al. 2020),
Bottom: ACA (0.87 mm) (Federman et al. 2022).
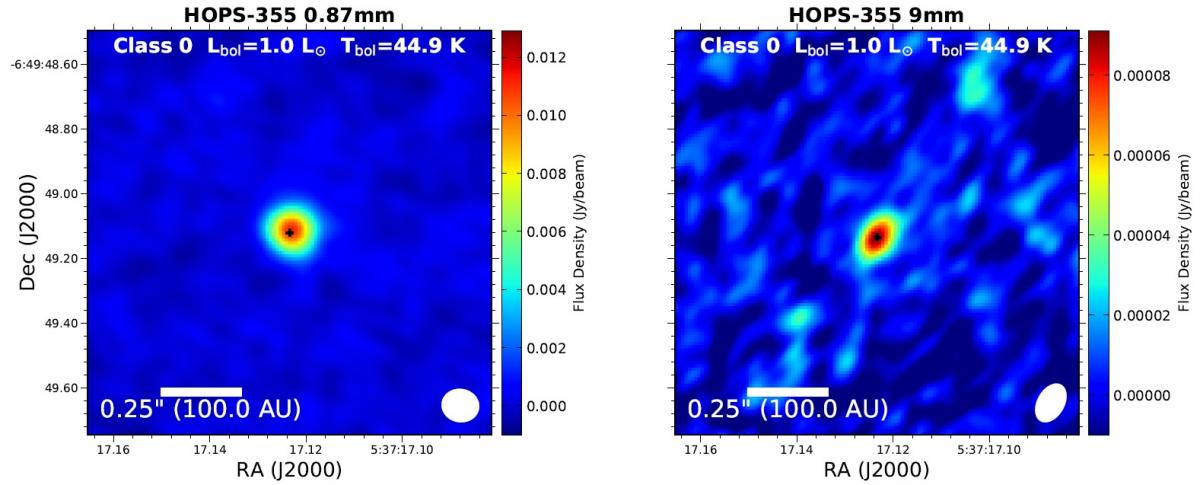
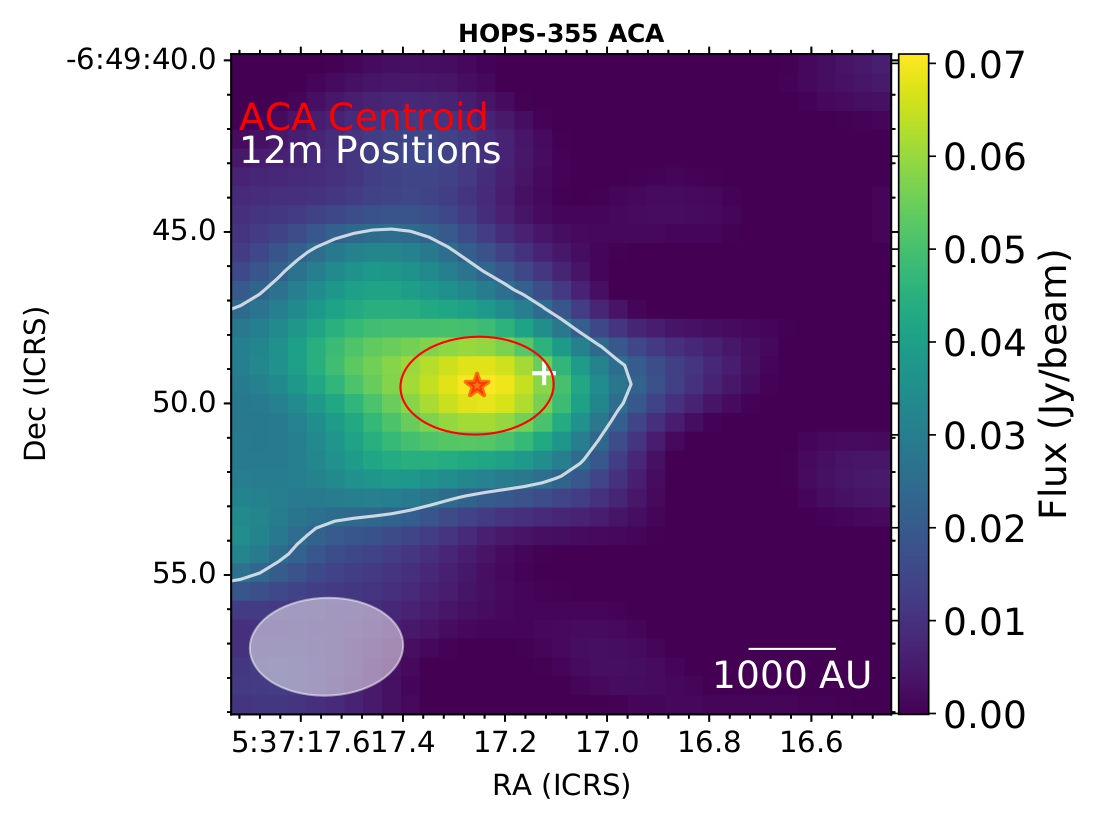
Figure 1: HOPS-355.
ALMA protostellar outflow survey (Hsieh et al. 2023).
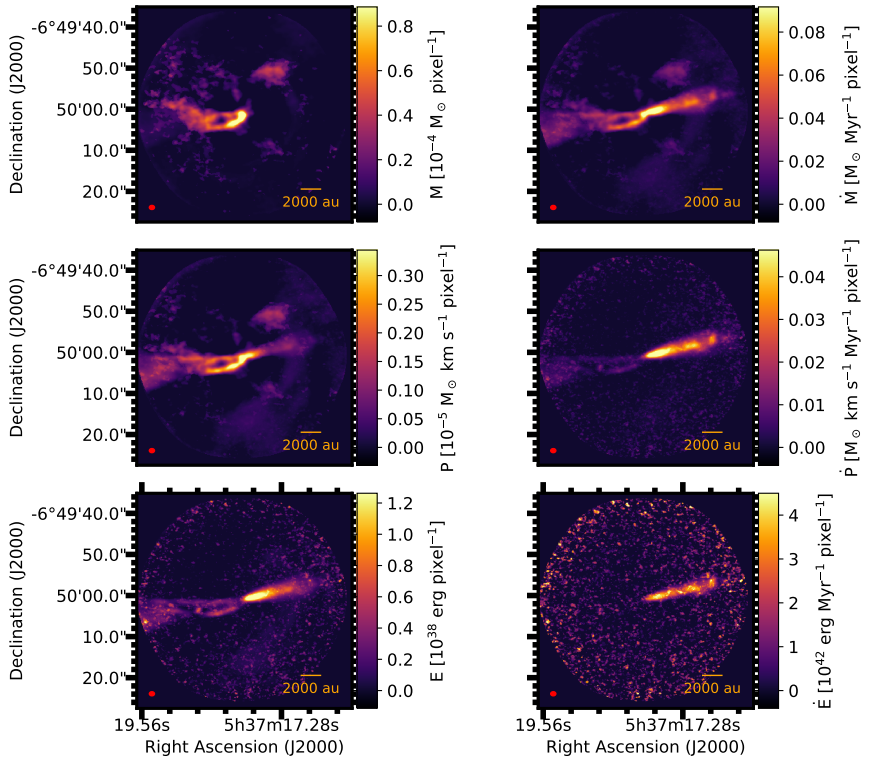
Figure 2: HOPS-355 molecular outflows mass, momentum and energy maps (panels in the left column) and the corresponding rate maps (panels in the right column).