
HOPS 323
|
Distance (pc) |
Zone |
|||||||
|
10.3 |
82.9 |
I |
392.8 |
NGC 2068 |
||||
|
ALMA 0.87 mm |
||||||||
|
Source |
||||||||
|
HOPS-323-A |
05:46:47.697 |
00:00:25.27 |
44.46 ± 0.75 |
34.10 |
0.34 |
0.1 |
0.07 x 0.05 |
30.9 |
|
HOPS-323-B |
05:46:47.667 |
00:00:24.81 |
81.35 ± 1.48 |
23.04 |
0.34 |
0.6 |
0.3 x 0.08 |
50.7 |
|
VLA 9 mm |
||||||||
|
Source |
||||||||
|
HOPS-323-A |
05:46:47.695 |
00:00:25.27 |
0.24 ± 0.02 |
0.198 |
10.01 |
10.3 |
0.04 x 0.01 |
51.4 |
|
HOPS-323-B |
05:46:47.664 |
00:00:24.79 |
0.1 ± 0.02 |
0.081 |
8.2 |
9.98 |
0.04 x 0.03 |
130.4 |
|
ACA 0.87 mm |
||||||||
|
Source |
||||||||
|
HOPS-323 |
05:46:47.688 |
+00:00:25.2 |
458.34 |
173.93 |
5.65 |
- |
- |
- |
ALMA and VLA Derived Parameters
|
Source |
||||||||
|
HOPS-323-A |
25.5 ± 10.0 |
13.1 ± 10.0 |
28.6 ± 0.5 |
214.5 ± 18.0 |
12.38 |
1.88 |
2.2 ± 0.07 |
2.3 ± 0.69 |
|
HOPS-323-B |
108.0 ± 10.0 |
14.6 ± 13.1 |
52.2 ± 1.0 |
90.9 ± 18.0 |
4.73 |
4.35 |
2.9 ± 0.1 |
4.5 ± 1.73 |
Sources next/close to me: -
Same source, other names: -
Source Images
Left: ALMA (0.87 mm), Right: VLA (9 mm) (Tobin et al. 2020).
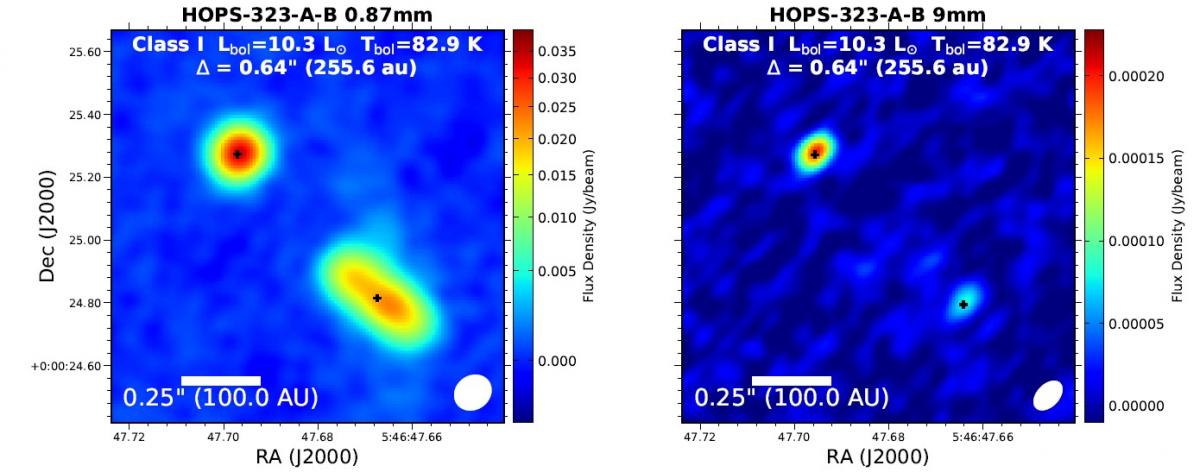
Figure 1: HOPS-323-A at north east and HOPS-323-B at south west.
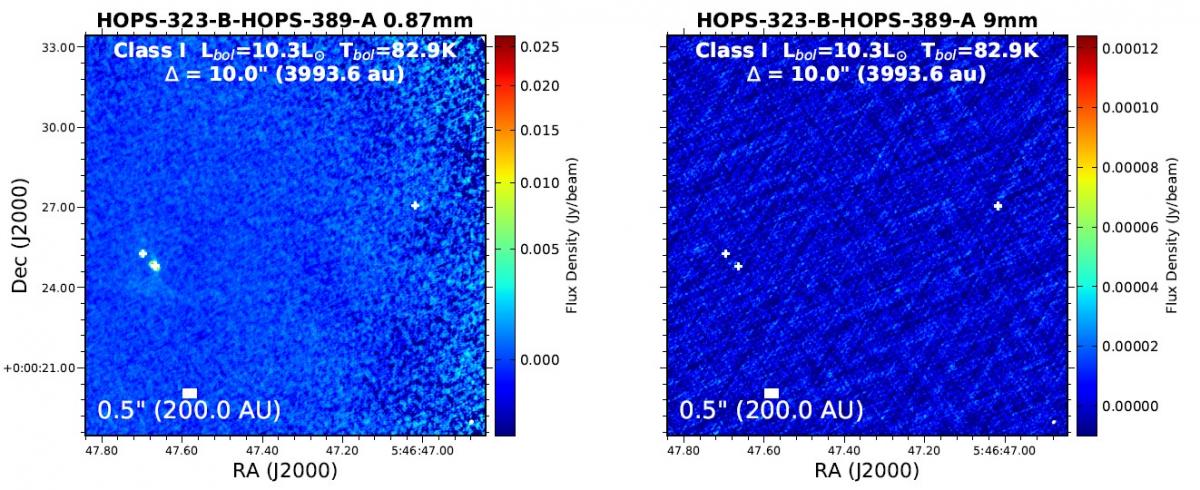
Figure 2: HOPS-323 at south east and HOPS-389 at north west.
ACA (0.87 mm) (Federman et al. 2022).
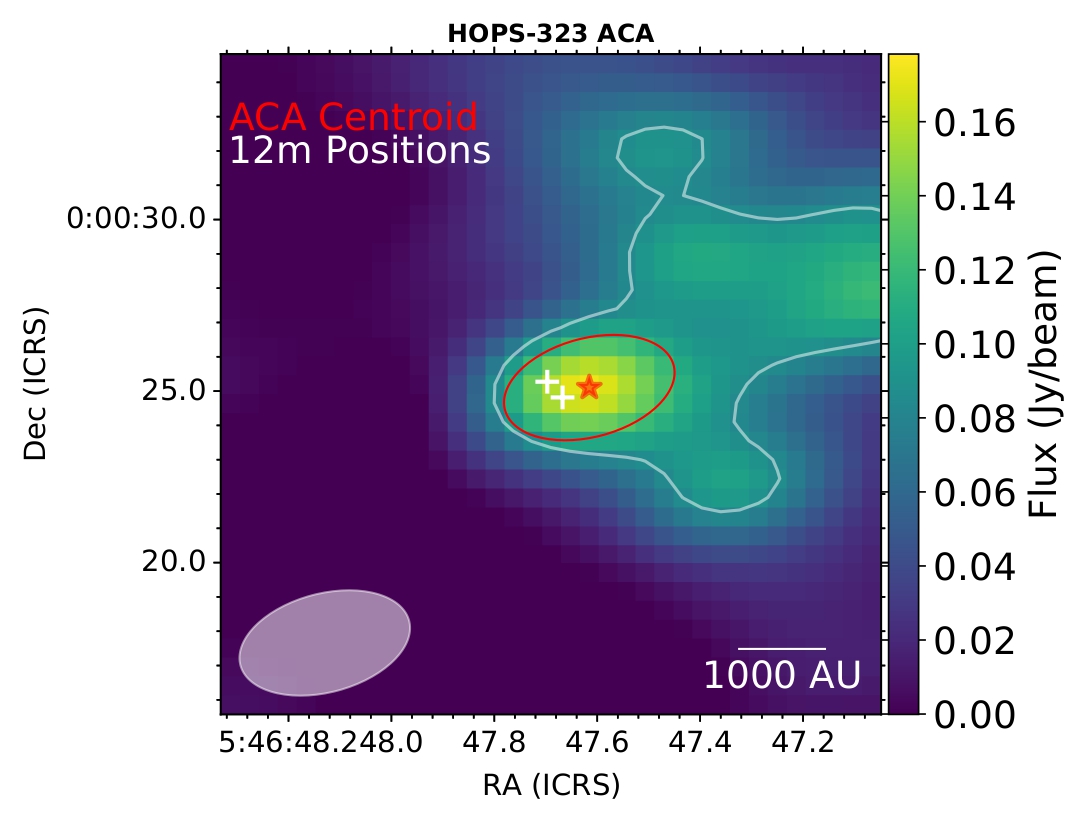
Figure 3: HOPS-323.