
HOPS 169
|
Distance (pc) |
Zone |
|||||||
|
3.3 |
32.5 |
0 |
384.0 |
LDN 1641 |
||||
|
ALMA 0.87 mm |
||||||||
|
Source |
||||||||
|
HOPS-169 |
05:36:36.160 |
-06:38:54.35 |
166.18 ± 3.38 |
69.53 |
0.93 |
2.5 |
0.17 x 0.13 |
61.5 |
|
VLA 9 mm |
||||||||
|
Source |
||||||||
|
HOPS-169 |
05:36:36.160 |
-06:38:54.35 |
0.282 ± 0.02 |
0.16 |
8.32 |
2.5 |
0.09 x 0.05 |
61.7 |
|
ACA 0.87 mm |
||||||||
|
Source |
||||||||
|
HOPS-169 |
05:36:36.12 |
-06:38:51.72 |
761.41 |
461.4 |
9.51 |
- |
- |
- |
ALMA and VLA Derived Parameters
|
Source |
||||||||
|
HOPS-169 |
53.8 ± 10.0 |
29.0 ± 10.0 |
118.5 ± 2.5 |
275.1 ± 22.5 |
3.46 |
1.71 |
2.7 ± 0.07 |
1.6 ± 0.72 |
Sources next/close to me: -
Same source, other names: -
Source Images
Left: ALMA (0.87 mm), Right: VLA (9 mm) (Tobin et al. 2020),
Bottom: ACA (0.87 mm) (Federman et al. 2022)
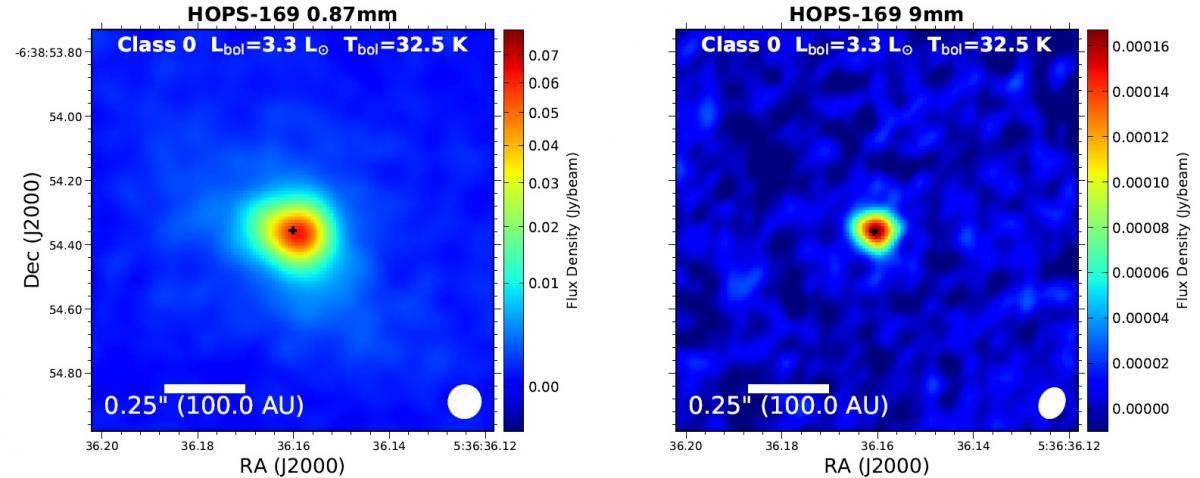
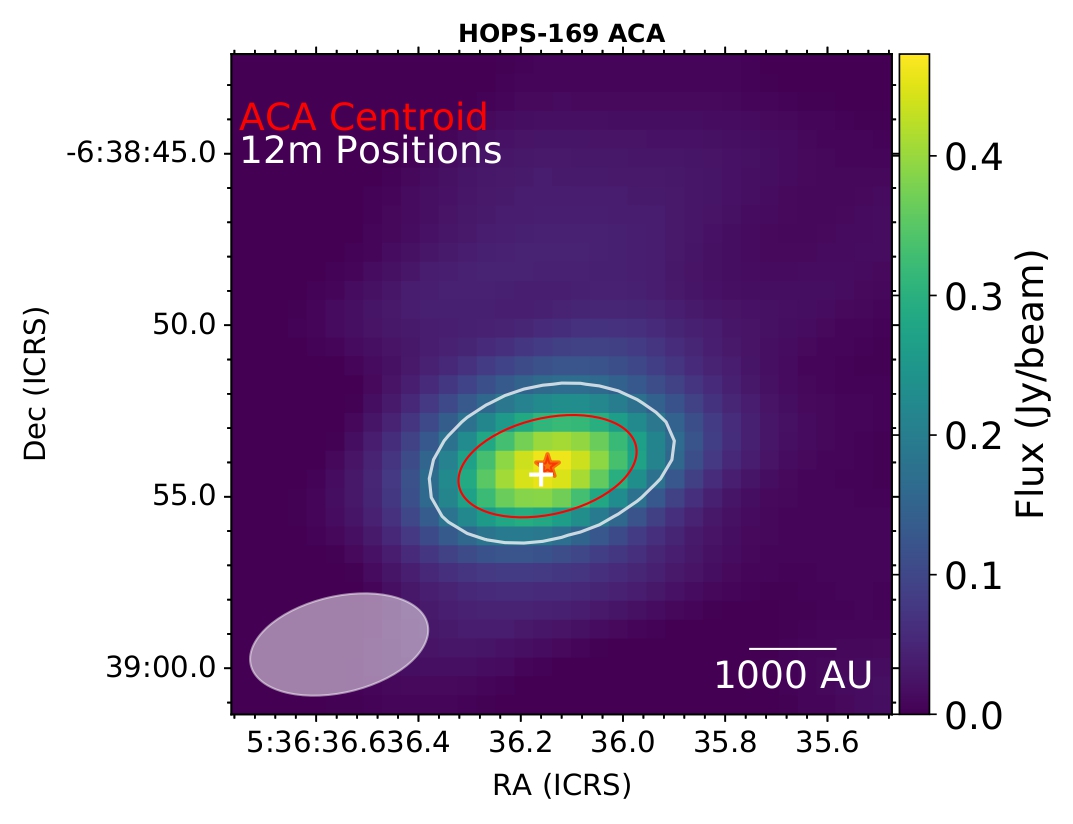
Figure 1: HOPS-169.
ALMA protostellar outflow survey (Hsieh et al. 2023).
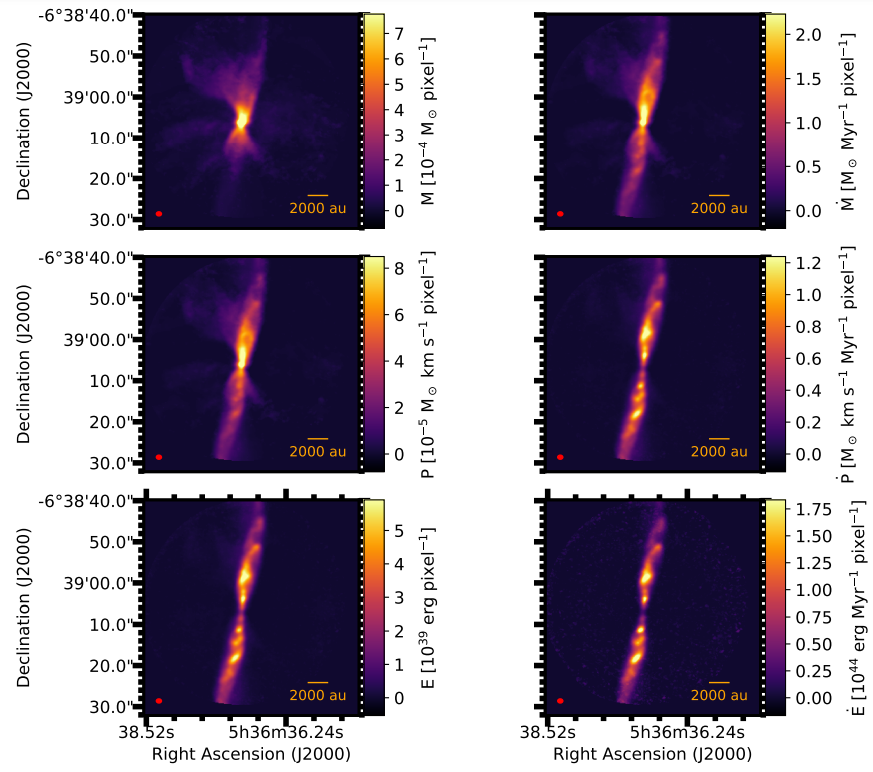
Figure 2: HOPS-169 molecular outflows mass, momentum and energy maps (panels in the left column) and the corresponding rate maps (panels in the right column).