
HOPS 150
|
Distance (pc) |
Zone |
|||||||
|
3.2 |
245.2 |
Flat |
388.5 |
LDN 1641 |
||||
|
ALMA 0.87 mm |
||||||||
|
Source |
||||||||
|
HOPS-150-A |
05:38:07.53 |
-07:08:29.01 |
22.78 ± 0.55 |
18.97 |
0.27 |
0.2 |
0.05 x 0.03 |
135.2 |
|
HOPS-150-B |
05:38:07.53 |
-07:08:32.23 |
5.1 ± 0.74 |
3.15 |
0.30 |
3.0 |
0.09 x 0.07 |
70.9 |
|
VLA 9 mm |
||||||||
|
Source |
||||||||
|
HOPS-150-A |
- |
- |
- |
- |
- |
- |
- |
- |
|
HOPS-150-B |
- |
- |
- |
- |
- |
- |
- |
- |
|
ACA 0.87 mm |
||||||||
|
Source |
||||||||
|
HOPS-150 |
05:38:07.536 |
-07:08:29.04 |
54.42 |
26.19 |
2.84 |
- |
- |
- |
ALMA and VLA Derived Parameters
|
Source |
||||||||
|
HOPS-150-A |
17.5 ± 10.0 |
- |
16.7 ± 0.4 |
- |
31.9 |
- |
- |
- |
|
HOPS-150-B |
31.0 ± 10.0 |
- |
3.7 ± 0.6 |
- |
125.68 |
- |
- |
- |
Sources next/close to me: -
Same source, other names: -
Source Images
ALMA (0.87 mm) (Tobin et al. 2020).
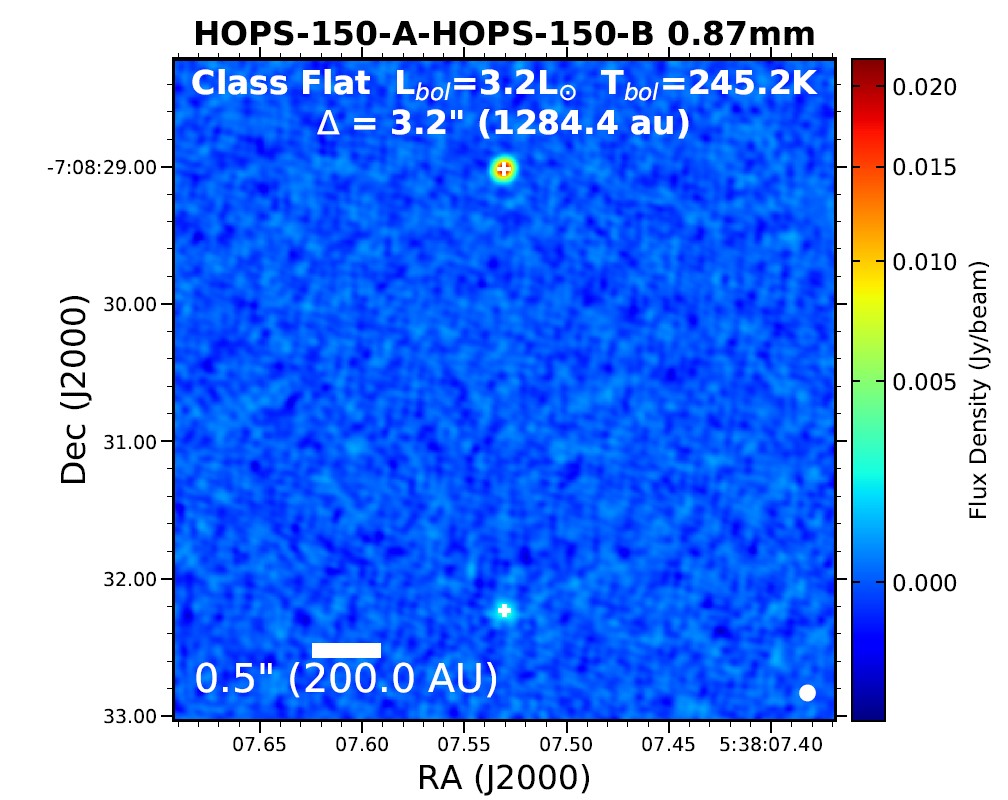
Figure 1: HOPS-150-A at north and HOPS-150-B at south.
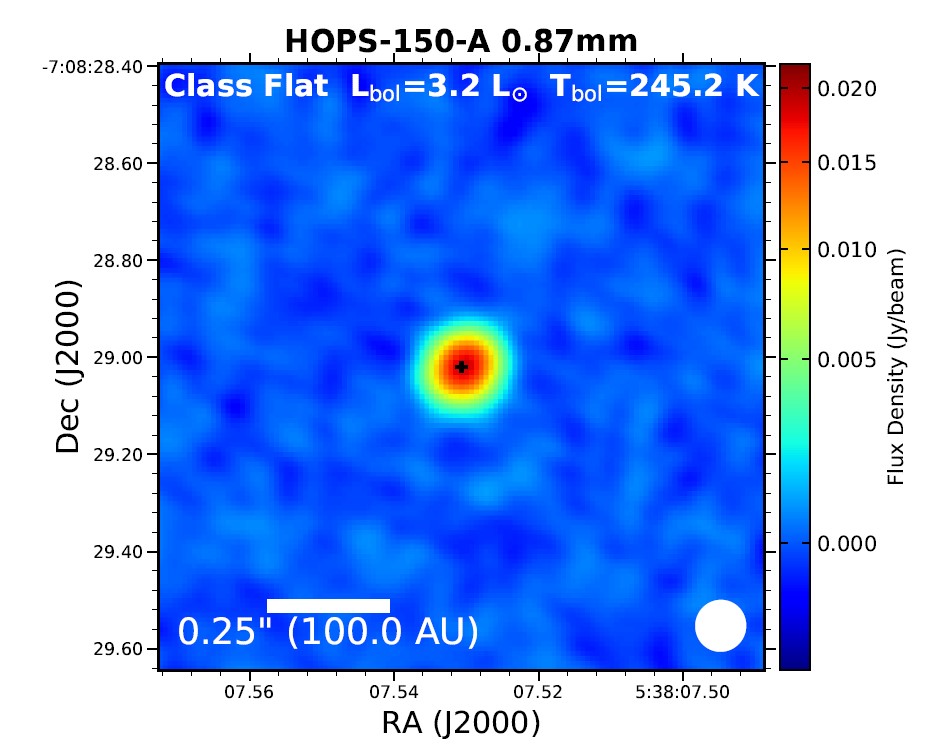
Figure 2: HOPS-150-A.
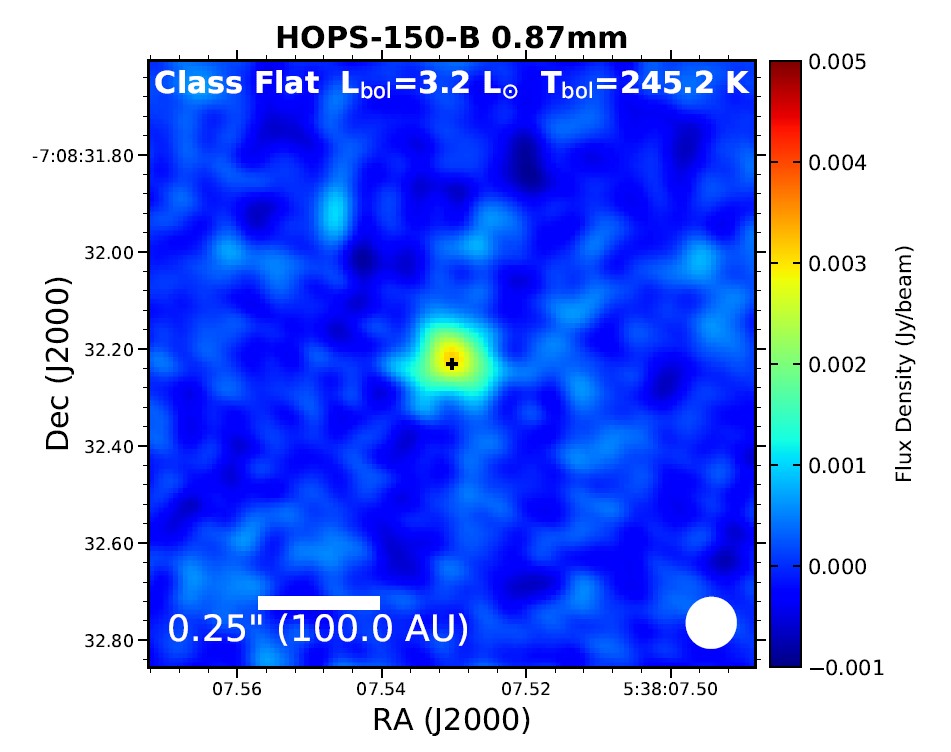
Figure 3: HOPS-150-B.
ACA (0.87 mm) (Federman et al. 2022).
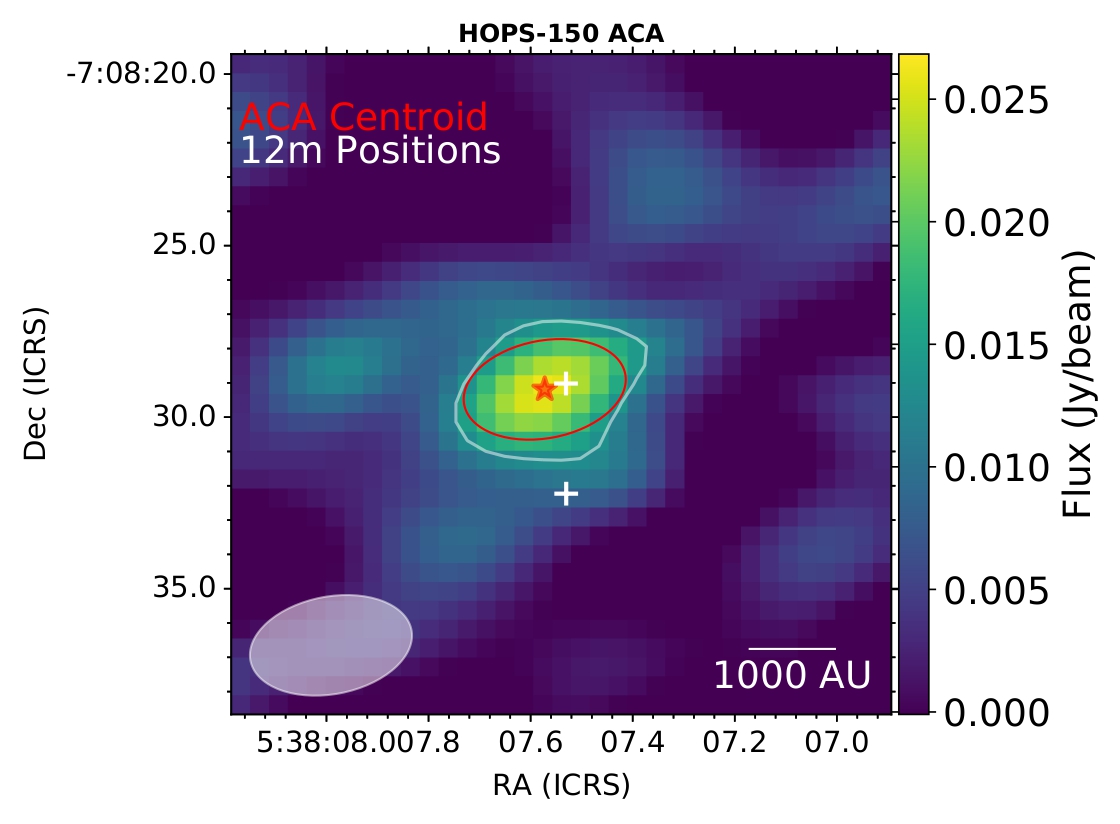
Figure 4: HOPS-150.
ALMA protostellar outflow survey (Hsieh et al. 2023).
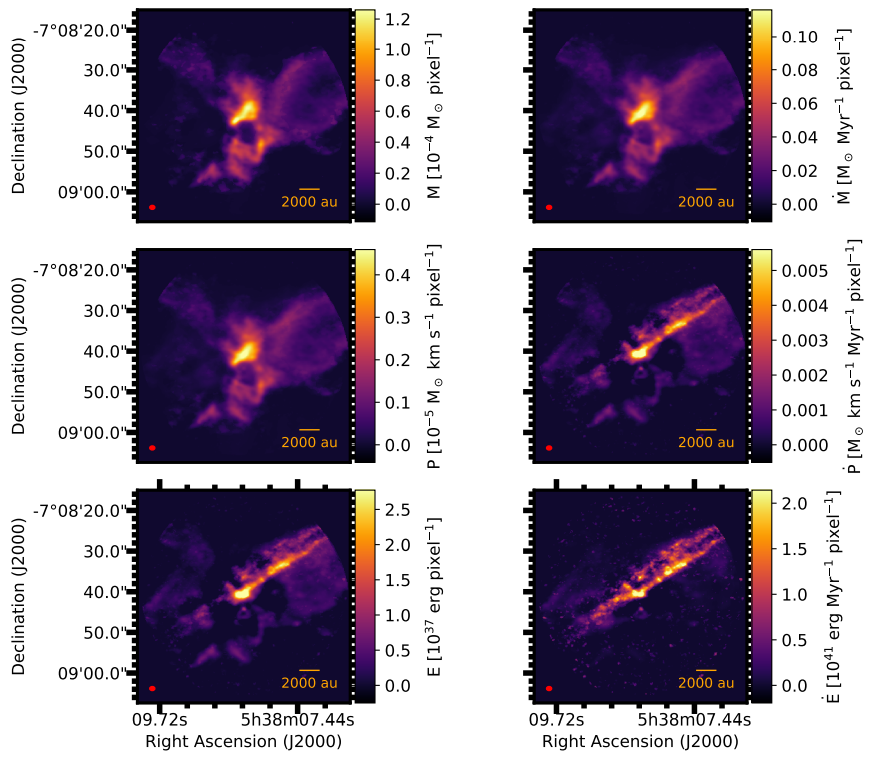
Figure 5: HOPS-150 molecular outflows mass, momentum and energy maps (panels in the left column) and the corresponding rate maps (panels in the right column).
Scattered dust emission as observed by the HST (Habel et al. 2021 ApJ, 911, 153).

Figure 6.