
HOPS 129
|
Distance (pc) |
Zone |
|||||||
|
1.5 |
191.3 |
Flat |
393.8 |
LDN 1641 |
||||
|
ALMA 0.87 mm |
||||||||
|
Source |
||||||||
|
HOPS-129 |
05:39:11.868 |
-07:10:34.88 |
54.86 ± 1.02 |
34.39 |
0.39 |
0.3 |
0.1 x 0.06 |
44.5 |
|
VLA 9 mm |
||||||||
|
Source |
||||||||
|
HOPS-129 |
- |
- |
- |
- |
- |
- |
- |
- |
|
ACA 0.87 mm |
||||||||
|
Source |
||||||||
|
HOPS-129 |
05:39:11.856 |
-07:10:35.04 |
65.33 |
59.93 |
3.9 |
- |
- |
- |
ALMA and VLA Derived Parameters
|
Source |
||||||||
|
HOPS-129 |
32.1 ± 10.0 |
- |
52.0 ± 1.0 |
- |
11.27 |
- |
- |
- |
Sources next/close to me: -
Same source, other names: -
Source Images
Top: ALMA (0.87 mm) (Tobin et al. 2020),
Bottom: ACA (0.87 mm) (Federman et al. 2022).
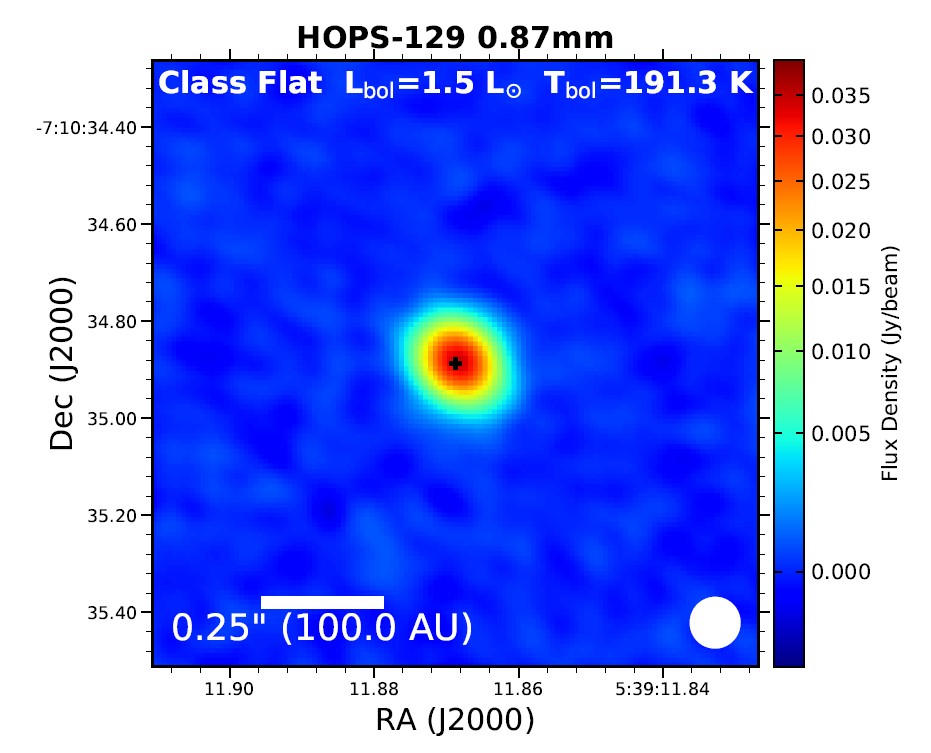
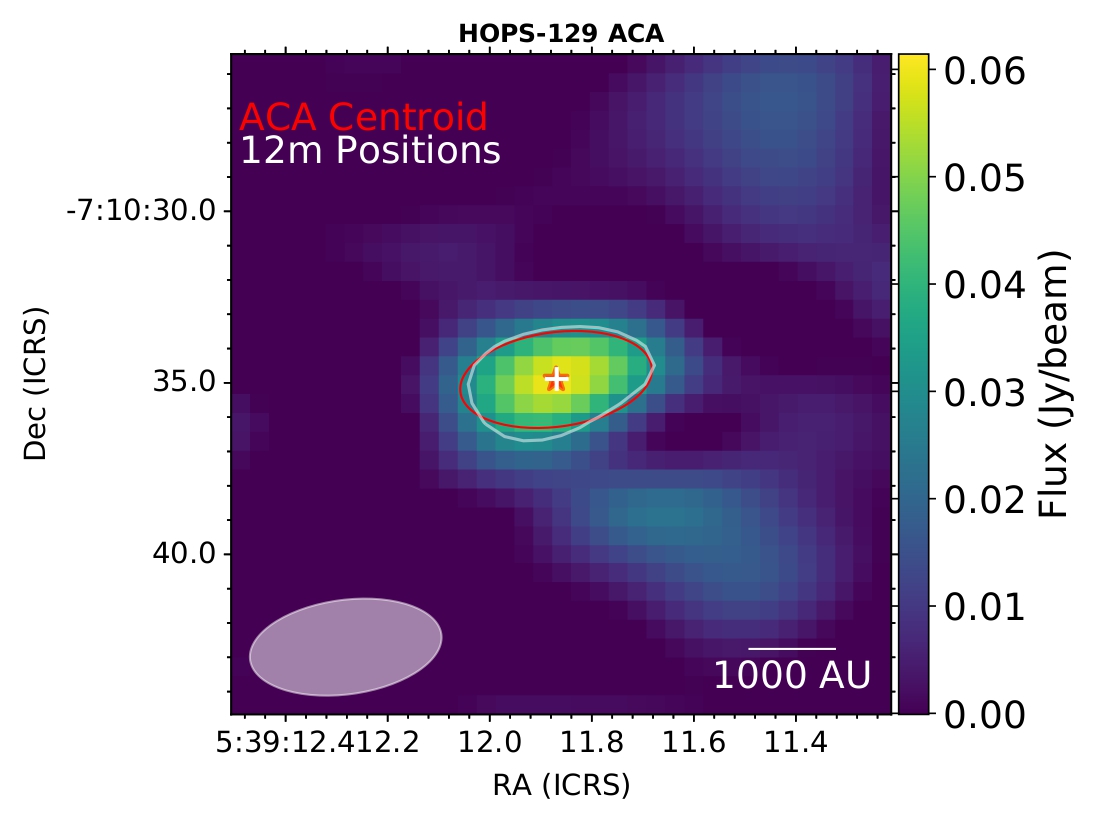
Figure 1: HOPS-129.
ALMA protostellar outflow survey (Hsieh et al. 2023).
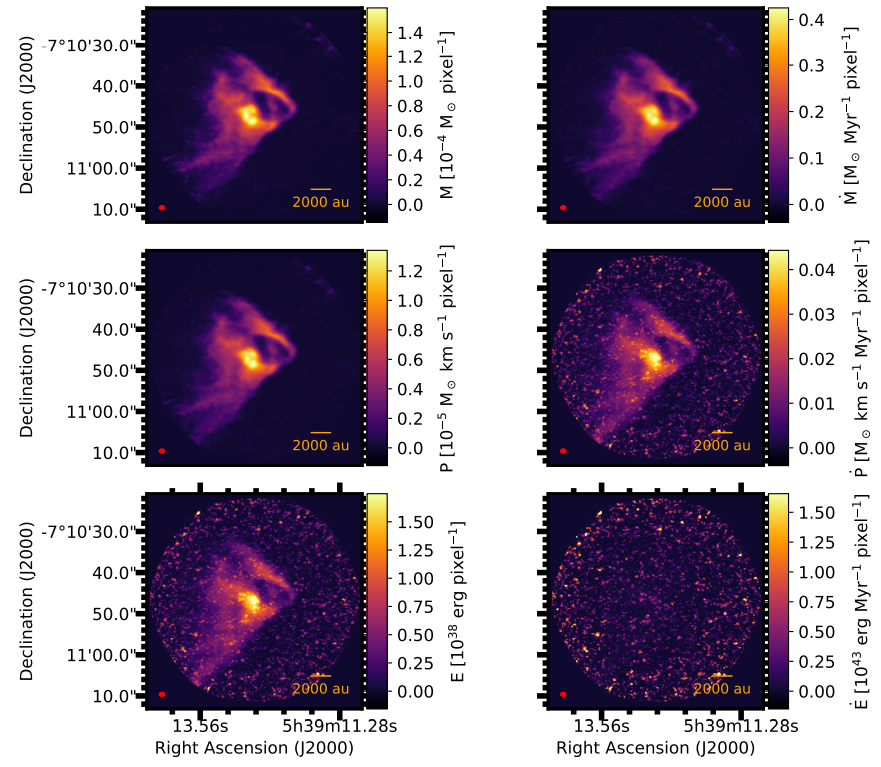
Figure 2: HOPS-129 molecular outflows mass, momentum and energy maps (panels in the left column) and the corresponding rate maps (panels in the right column).