
HOPS 127
|
Distance (pc) |
Zone |
|||||||
|
0.3 |
133.3 |
I |
394.5 |
LDN 1641 |
||||
|
ALMA 0.87 mm |
||||||||
|
Source |
||||||||
|
HOPS-127 |
05:39:00.972 |
-07:20:22.55 |
8.93 ± 0.46 |
7.88 |
0.23 |
0.5 |
0.05 x 0.03 |
36.7 |
|
VLA 9 mm |
||||||||
|
Source |
||||||||
|
HOPS-127 |
- |
- |
- |
- |
- |
- |
- |
- |
|
ACA 0.87 mm |
||||||||
|
Source |
||||||||
|
HOPS-127 |
05:39:00.936 |
-07:20:22.56 |
2.23 |
4.76 |
0.49 |
- |
- |
- |
ALMA and VLA Derived Parameters
|
Source |
||||||||
|
HOPS-127 |
15.4 ± 10.0 |
- |
13.2 ± 0.7 |
- |
81.12 |
- |
- |
- |
Sources next/close to me: -
Same source, other names: -
Source Images
Top: ALMA (0.87 mm) (Tobin et al. 2020),
Bottom: ACA (0.87 mm) (Federman et al. 2022).
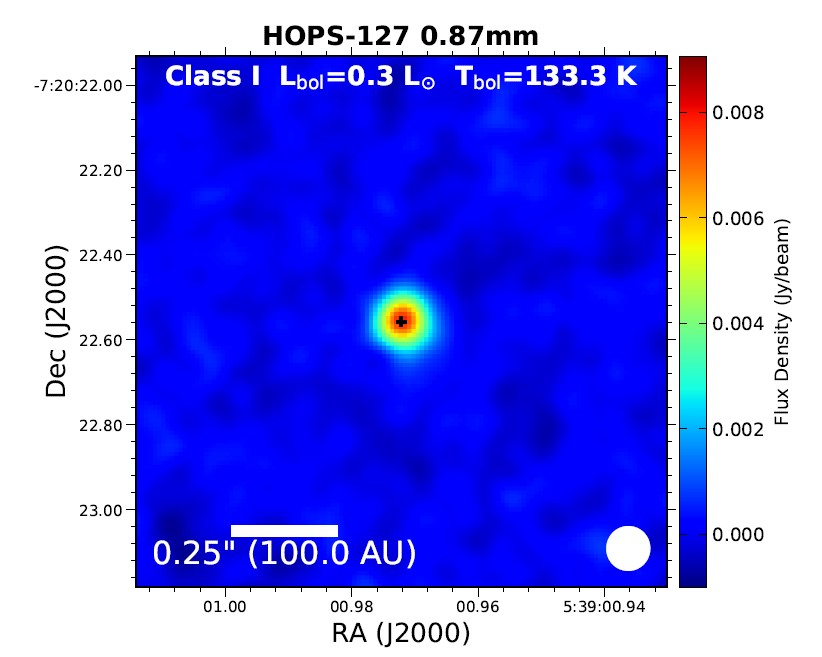
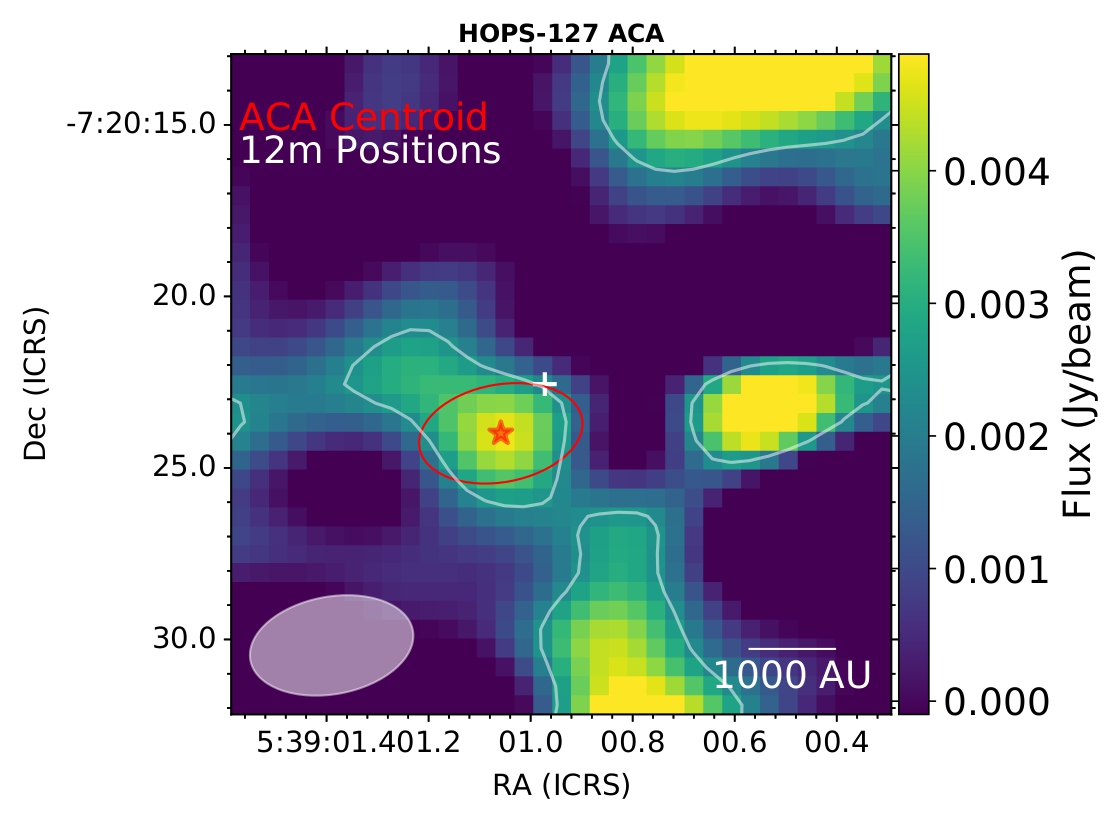
Figure 1: HOPS-127.
ALMA protostellar outflow survey (Hsieh et al. 2023).
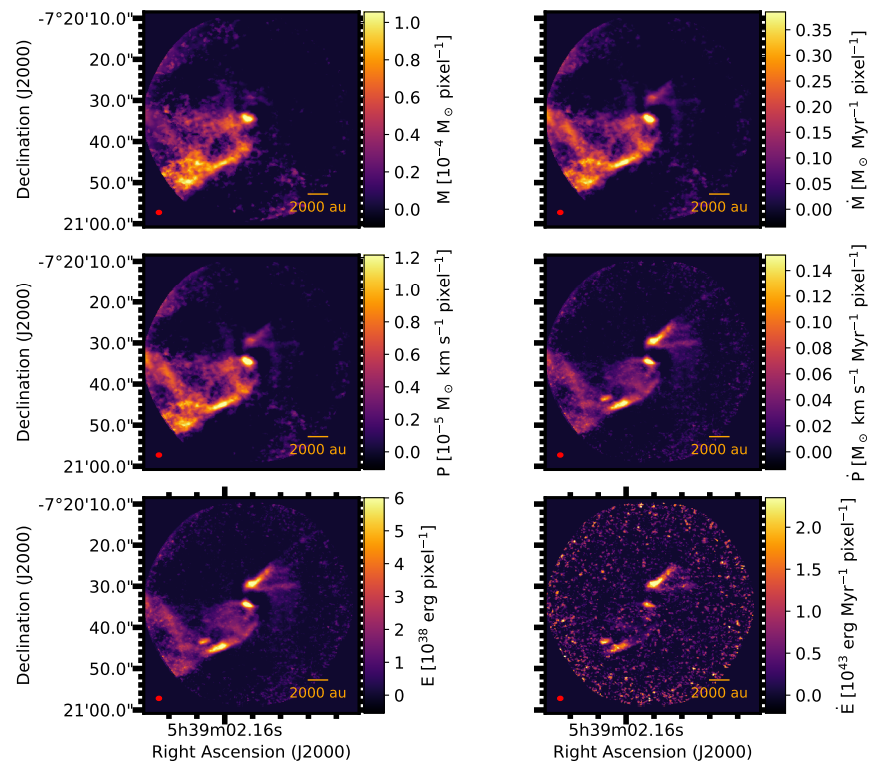
Figure 2: HOPS-127 molecular outflows mass, momentum and energy maps (panels in the left column) and the corresponding rate maps (panels in the right column).