
HOPS 10
|
Distance (pc) |
Zone |
|||||||
|
2.8 |
46.2 |
0 |
388.2 |
OMC 1/ONC |
||||
|
ALMA 0.87 mm |
||||||||
|
Source |
||||||||
|
HOPS-10 |
05:35:09.050 |
-05:58:26.87 |
69.21 ± 1.33 |
33.17 |
0.43 |
1.0 |
0.14 x 0.07 |
116.6 |
|
VLA 9 mm |
||||||||
|
Source |
||||||||
|
HOPS-10 |
05:35:09.052 |
-05:58:26.87 |
0.49 ± 0.02 |
0.29 |
7.8 |
1.0 |
0.08 x 0.05 |
124.8 |
|
ACA 0.87 mm |
||||||||
|
Source |
||||||||
|
HOPS-10 |
05:35:09 |
-05:58:27.48 |
268.62 |
129.93 |
4.29 |
- |
- |
- |
ALMA and VLA Derived Parameters
|
Source |
||||||||
|
HOPS-10 |
46.8 ± 10.0 |
26.4 ± 10.0 |
52.5 ± 1.0 |
502.9 ± 22.7 |
8.41 |
0.98 |
2.1 ± 0.06 |
2.1 ± 0.38 |
Sources next/close to me: -
Same source, other names: -
Source Images
Left: ALMA (0.87 mm), Right: VLA (9 mm) (Tobin et al. 2020),
Bottom: ACA (0.87 mm) (Federman et al. 2022)
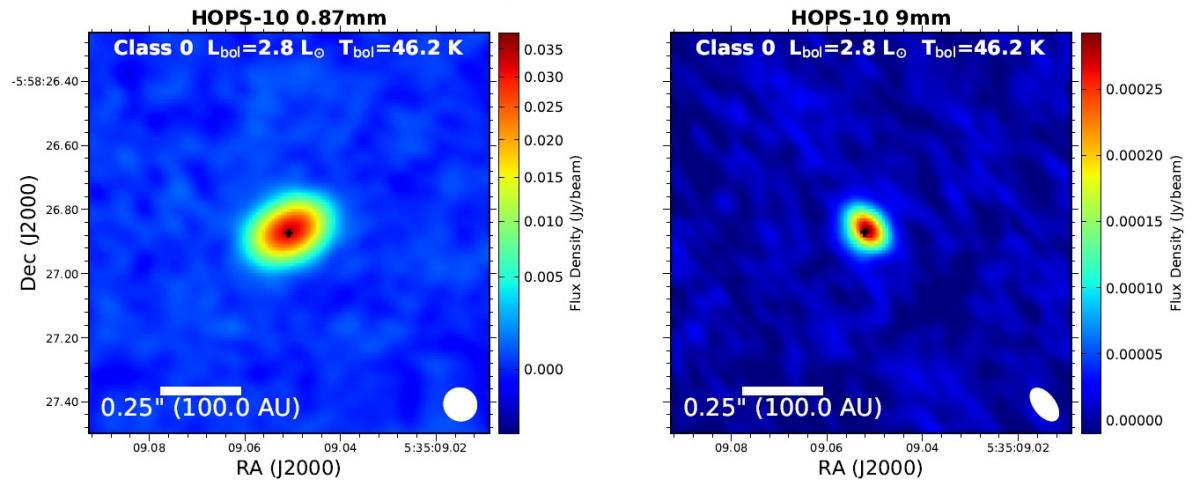
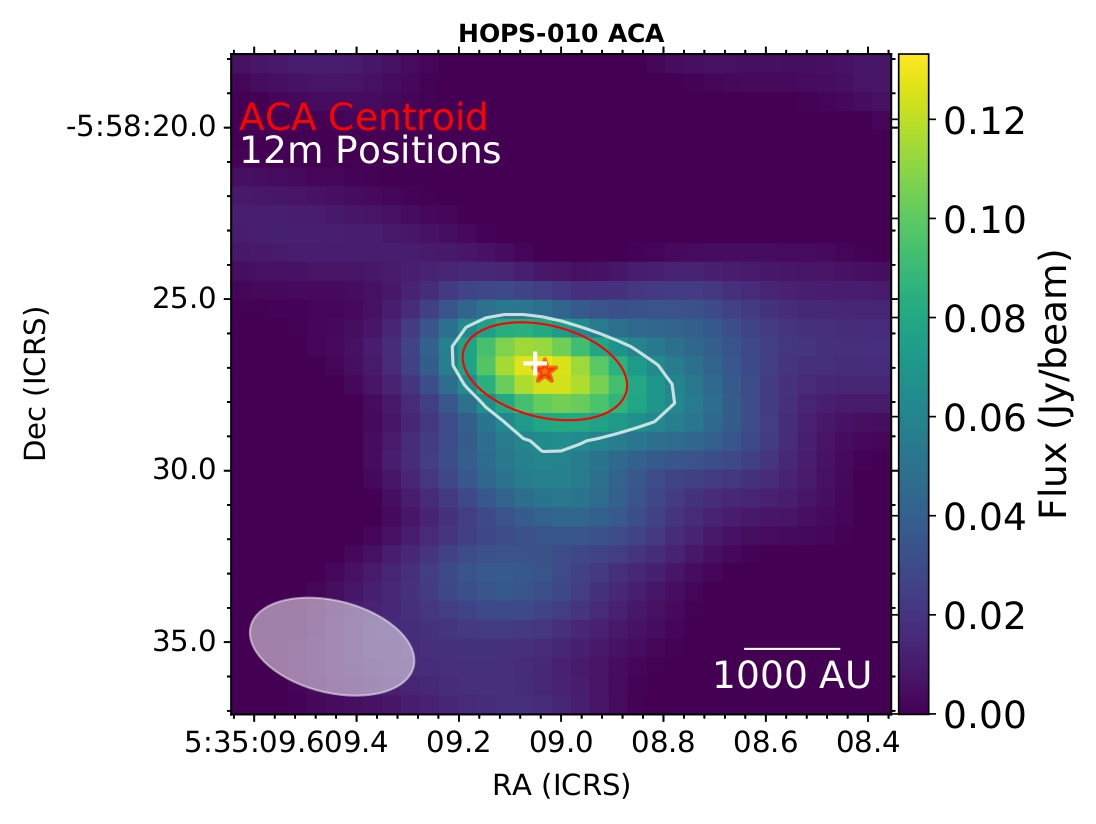
Figure 1: HOPS-10.
ALMA protostellar outflow survey (Hsieh et al. 2023).
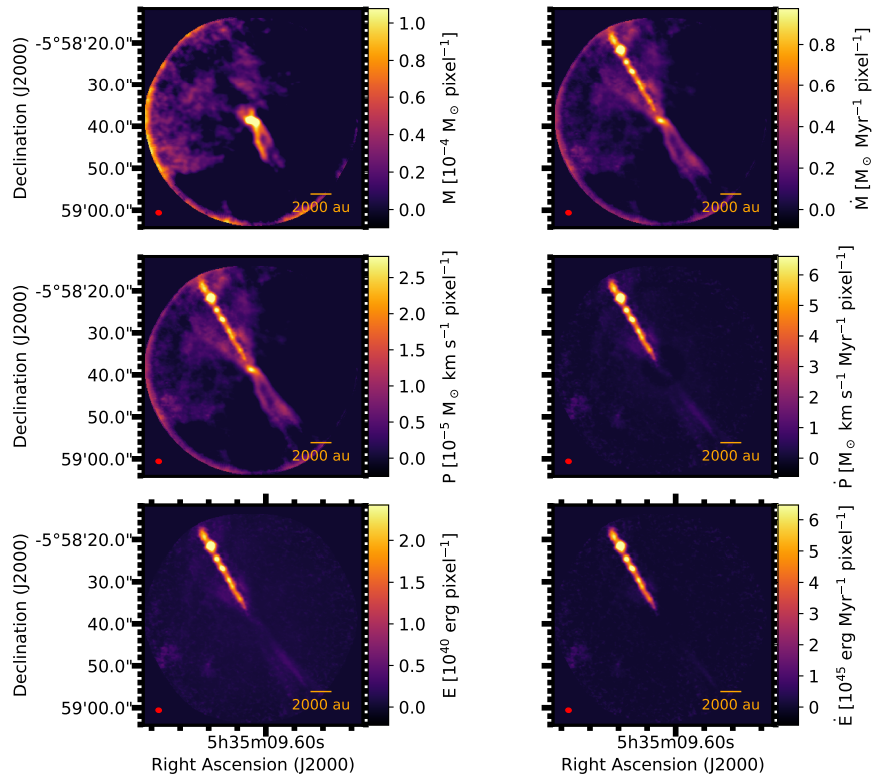
Figure 2: HOPS-10 molecular outflow mass, momentum, and energy maps (panels in left column), and the corresponding rate maps (panels in right column).